|

Silver Miners ETF (SIL) rides strong bullish wave

The Global X Silver Miners ETF (SIL), launched in April 2010, tracks the Solactive Global Silver Miners Total Return Index, offering exposure to silver mining companies like Wheaton Precious Metals and Pan American Silver. With over $1 billion in assets, SIL provides a volatile yet targeted investment option for those seeking to capitalize on silver price movements through mining equities. Below we will look at the Elliott Wave path of the instrument.

SIL (Silver Miners ETF) monthly Elliott Wave chart

Chart

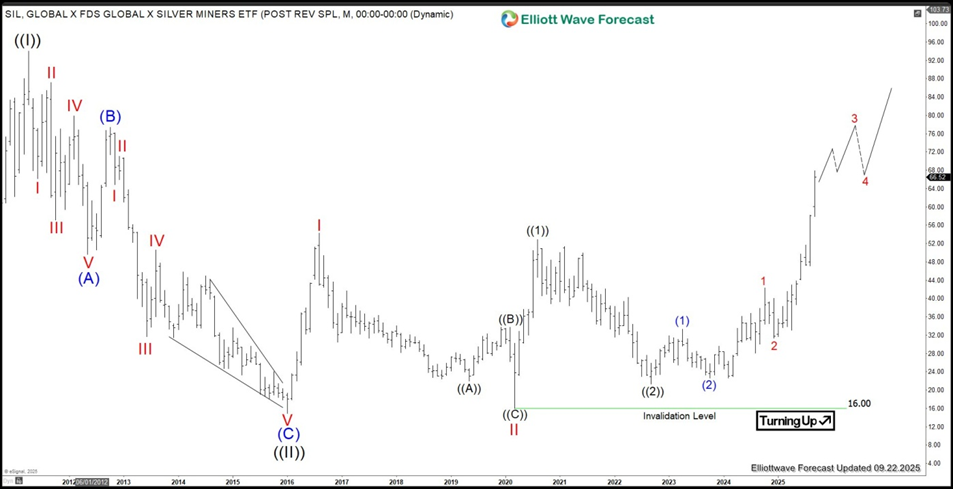
The monthly Elliott Wave chart indicates that the Silver Miners Junior ETF (SIL) formed a Grand Super Cycle wave ((II)) low at $14.94 in January 2016. Since then, it has rallied strongly in a nested impulse structure. From the wave ((II)) low, wave I peaked at $54.34, followed by a wave II pullback to $16. Wave III is currently unfolding as another impulse. The rally from the wave II low completed wave ((1)) at $52.87. A subsequent dip in wave ((2)) concluded at $21.26. As long as the $16 pivot low holds, the ETF is expected to continue its upward trajectory.

Silver Miners ETF daily Elliott Wave chart

Chart

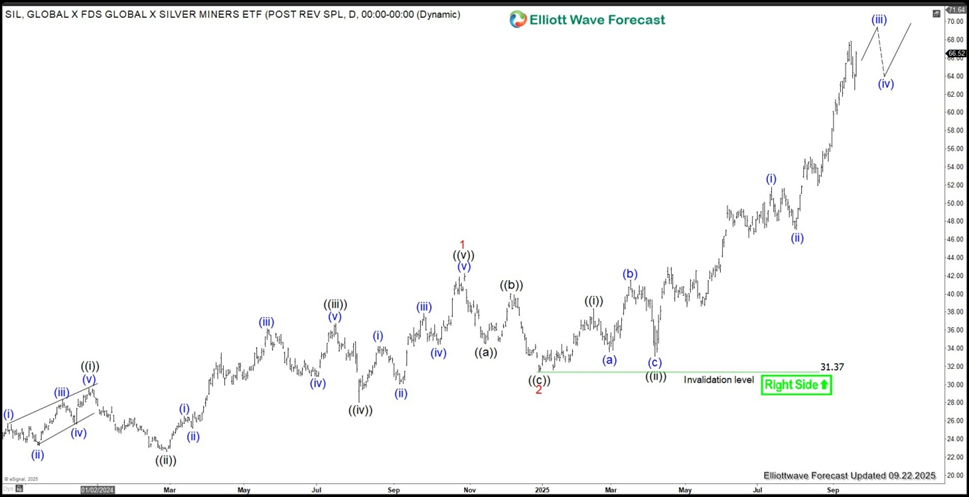
The daily chart for the Global X Silver Miners ETF (SIL) shows a rally from the September 1, 2022 low is unfolding as a nested impulse structure. From this low, wave (1) peaked at $33.24, followed by a wave (2) pullback to $22.57. The ETF then extended higher in wave (3), structured as another impulse. Within wave (3), wave 1 concluded at $42.29, with a wave 2 pullback ending at $31.37. In the near term, as long as the $31.37 pivot low remains intact, the ETF should continue its upward trend.

Author

Elliott Wave Forecast Team

Elliott Wave Forecast Team

ElliottWave-Forecast.com

More from Elliott Wave Forecast Team
Share:

Markets move fast. We move first.

Orange Juice Newsletter brings you expert driven insights - not headlines. Every day on your inbox.

By subscribing you agree to our Terms and conditions.

Editor's Picks

EUR/USD holds steady below 1.1800

EUR/USD moves sideways in a narrow channel below 1.1800 as the market volatility remains low ahead of the New Year holiday. On Tuesday, investors will pay close attention to the minutes of the Federal Reserve's December policy meeting.

GBP/USD retreats below 1.3500 as trading conditions remain thin

GBP/USD corrects lower after posting strong gains in the previous week and trades below 1.3500 on Monday. With the action in financial markets turning subdued following the Christmas holiday, however, the pair's losses remain limited.

Gold extends correction from record-high, trades below $4,400

Gold retreats sharply from the record-peak it set at $4,550 and trades below $4,400, losing more than 3% on the day. Growing optimism about a Ukraine-Russia peace agreement and profit-taking ahead of the New Year holiday seem to be causing XAU/USD to stay under heavy bearish pressure.

Bitcoin, Ethereum, and XRP bulls regain strength

Bitcoin, Ethereum, and Ripple record roughly 3% gains on Monday, regaining strength mid-holiday season. Despite thin liquidity in the holiday season, BTC and major altcoins are regaining strength as US President Donald Trump pushes peace talks between Russia and Ukraine. The technical outlook for Bitcoin, Ethereum, and Ripple gradually shifts bullish as selling pressure wanes.

Economic outlook 2026-2027 in advanced countries: Solidity test

After a year marked by global economic resilience and ending on a note of optimism, 2026 looks promising and could be a year of solid economic performance. In our baseline scenario, we expect most of the supportive factors at work in 2025 to continue to play a role in 2026.

Crypto market outlook for 2026

Year 2025 was volatile, as crypto often is.  Among positive catalysts were favourable regulatory changes in the U.S., rise of Digital Asset Treasuries (DAT), adoption of AI and tokenization of Real-World-Assets (RWA).