Silver consolidates near $36.00 with risk-on sentiment limiting gains
- Silver consolidates near $36.00 as markets continue to favour risk assets.
- XAG/USD trades in a tight range with a potential Doji candle forming on the daily chart.
- Current price action remains supported above the key support level near $35.40.

Silver is holding within a tight range on Monday, with XAG/USD consolidating around the key $36.00 psychological level at the time of writing.
The metal is under modest pressure as broader market sentiment favours risk. US equities are holding onto recent gains near record highs. Increased appetite for risk continues to weigh on demand for traditional safe-haven assets, limiting Silver’s gains.
Intraday support has emerged around the current session low of $35.41, which has helped limit the downside move for Silver throughout June.
Silver technical analysis: XAG/USD consolidates in a tight range around $36.00
The daily candlestick shows a small-bodied candle with a pronounced lower wick, resembling a potential Doji formation.
This type of pattern typically appears when there is indecision in the market. Buyers and sellers push prices in both directions, but neither side gains clear control by the end of the day. The lower wick highlights earlier selling pressure that was met with buying interest near a key support level.
The 20-day Simple Moving Average is providing additional resistance at $36.11. The XAG/USD price action, coupled with the Relative Strength Index (RSI) near 55, suggests that the market is in a potential consolidation phase.
The presence of support around the 23.6% Fibonacci retracement level of the April-June incline provides a solid technical floor at $35.12. Meanwhile, resistance levels above may cap gains in the short term.
Silver (XAG/USD) daily chart
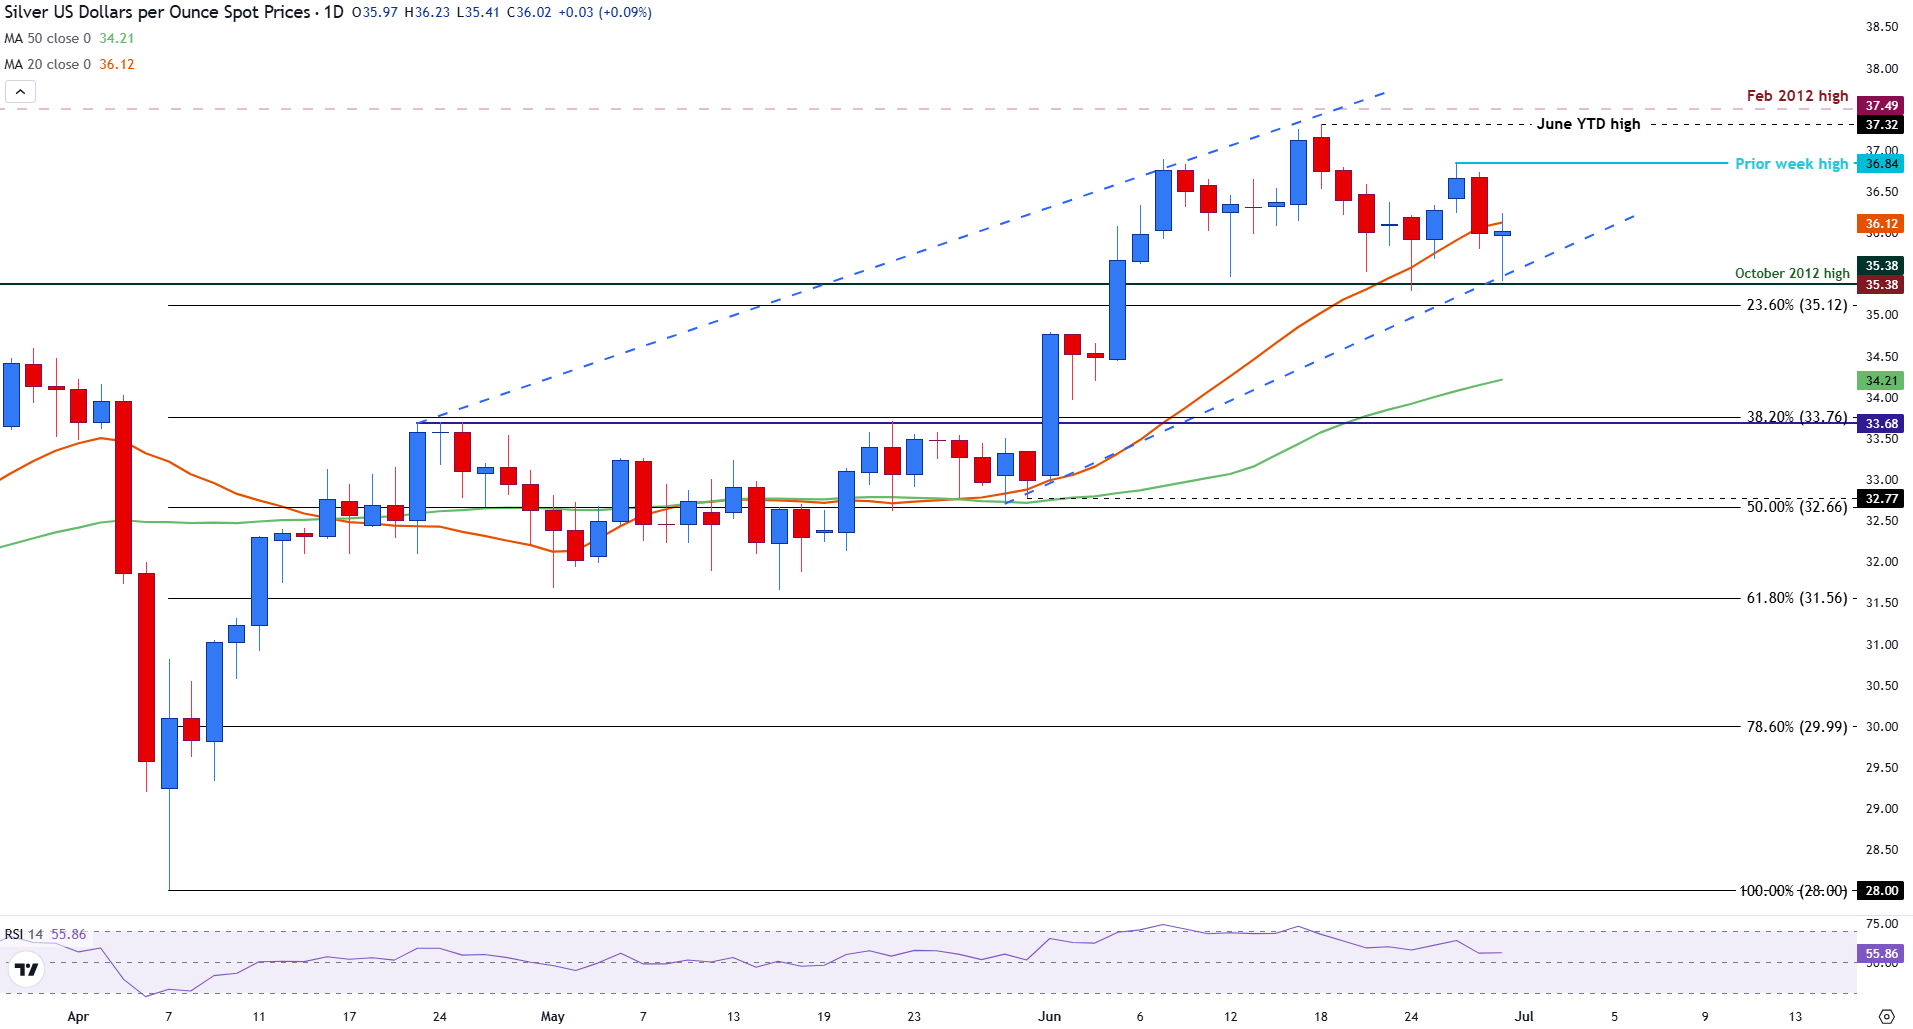
If price maintains support above $35.38 and reclaims the 20-day SMA at $36.12, buyers could push Silver back toward the prior week’s high at $36.84.
A confirmed breakout above this level would expose the June YTD high of $37.32 and possibly the February 2012 high at $37.49, strengthening the broader uptrend.
In contrast, failure to hold above $35.38 support could trigger a breakdown below the rising channel, opening the door to further downside toward the 50-day SMA at $34.21.
If that level fails, the next support lies at the 38.2% Fibonacci retracement near $33.76, potentially signalling a deeper correction within the broader trend.
Silver FAQs
Silver is a precious metal highly traded among investors. It has been historically used as a store of value and a medium of exchange. Although less popular than Gold, traders may turn to Silver to diversify their investment portfolio, for its intrinsic value or as a potential hedge during high-inflation periods. Investors can buy physical Silver, in coins or in bars, or trade it through vehicles such as Exchange Traded Funds, which track its price on international markets.
Silver prices can move due to a wide range of factors. Geopolitical instability or fears of a deep recession can make Silver price escalate due to its safe-haven status, although to a lesser extent than Gold's. As a yieldless asset, Silver tends to rise with lower interest rates. Its moves also depend on how the US Dollar (USD) behaves as the asset is priced in dollars (XAG/USD). A strong Dollar tends to keep the price of Silver at bay, whereas a weaker Dollar is likely to propel prices up. Other factors such as investment demand, mining supply – Silver is much more abundant than Gold – and recycling rates can also affect prices.
Silver is widely used in industry, particularly in sectors such as electronics or solar energy, as it has one of the highest electric conductivity of all metals – more than Copper and Gold. A surge in demand can increase prices, while a decline tends to lower them. Dynamics in the US, Chinese and Indian economies can also contribute to price swings: for the US and particularly China, their big industrial sectors use Silver in various processes; in India, consumers’ demand for the precious metal for jewellery also plays a key role in setting prices.
Silver prices tend to follow Gold's moves. When Gold prices rise, Silver typically follows suit, as their status as safe-haven assets is similar. The Gold/Silver ratio, which shows the number of ounces of Silver needed to equal the value of one ounce of Gold, may help to determine the relative valuation between both metals. Some investors may consider a high ratio as an indicator that Silver is undervalued, or Gold is overvalued. On the contrary, a low ratio might suggest that Gold is undervalued relative to Silver.
Author

Tammy Da Costa, CFTe®
FXStreet
Tammy is an economist and market analyst with a deep passion for financial markets, particularly commodities and geopolitics.


