Silver consolidates near $33.50 after breakout, eyes $34.50 next
- Silver (XAG/USD) starts the week steady above $33.00 after posting a 4% gain last week.
- Key resistance is seen at $33.70–$34.00; a break above could expose March’s high near $34.50.
- Support rests at $32.60–$32.80, with deeper downside risk toward $32.00 and $31.00 if breached.

The Silver (XAG/USD) pair starts the week on a steady footing, hovering near $33.40 during the American trading hours on Monday, after gaining nearly 4% in the previous week on the back of a bullish technical breakout and renewed safe-haven demand.
Spot prices edged slightly lower earlier at the start of the day as signs of easing global trade tensions provided some support to a broadly weak US Dollar (USD). However, the white metal is holding ground above the $33.00 psychological mark. Markets are in ‘wait and see’ mode after last week’s big move, not yet ready to pick a new direction. While price action remains constructive, with buyers maintaining control as the metal trades above its short-term moving average, near-term momentum has cooled slightly. Nonetheless, the broader structure continues to favor further upside as long as key support levels hold.
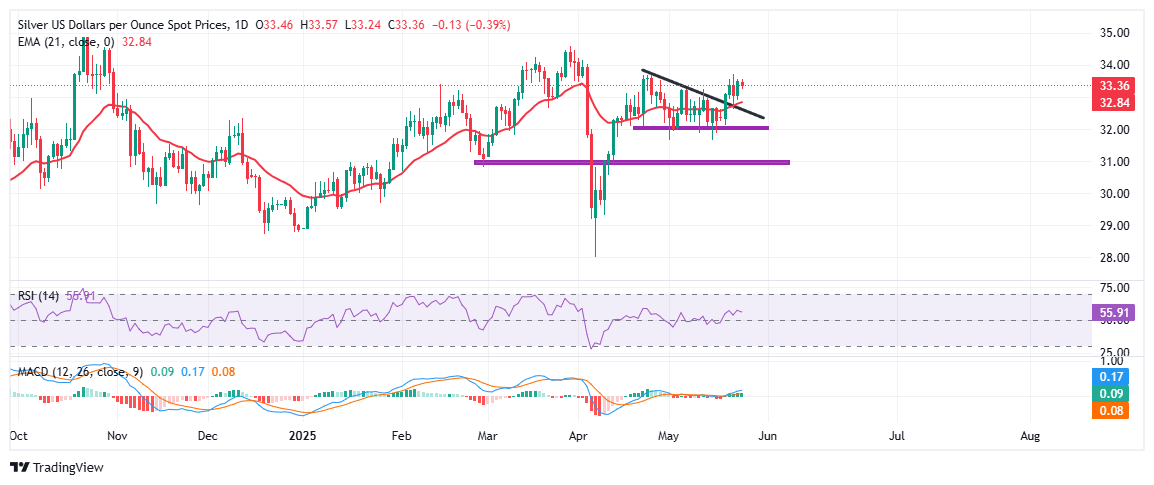
Zooming in on the daily chart, XAG/USD confirmed last week a breakout from a multi-week symmetrical triangle pattern that had capped upside momentum since mid-April and early May. Spot prices surged through the descending trendline resistance last week on Tuesday, with follow-through buying on Wednesday and a retest of the trendline on Thursday. Since the classic breakout-retest, the price has remained sideways. This breakout was confirmed with multiple daily closes above the triangle chart pattern around $32.60–$32.80, which closely aligns with the 21-day Exponential Moving Average (EMA).
At the time of writing, Silver’s hanging out just below Friday’s high of $33.54, suggesting a mild pause in bullish momentum. However, the short pullback remains shallow and well-contained within a consolidation range, indicating that the market is not witnessing any aggressive profit-taking.
The $33.70–$34.00 area now acts as a key resistance zone. A sustained move above this region could open the door for a retest of March’s high near $34.60, followed by the $35.00 round figure as the next upside target. On the flip side, initial support is seen at the $32.80–$32.60 breakout zone, reinforced by both the upper boundary of the former triangle and the 21-day EMA. A break below this level would likely trigger a deeper correction, with 32.00 being the first line of defense, followed by the $31.00 zone near mid-April.
Momentum indicators continue to paint a moderately bullish picture. The Relative Strength Index (RSI) is holding above the neutral 50 level, currently at 56.24, showing no signs of overbought conditions and leaving room for a fresh leg higher. Meanwhile, the Moving Average Convergence Divergence (MACD) remains in positive territory with a slight bullish divergence developing, reinforcing the view that price action is pausing rather than reversing.
Author

Vishal Chaturvedi
FXStreet
I am a macro-focused research analyst with over four years of experience covering forex and commodities market. I enjoy breaking down complex economic trends and turning them into clear, actionable insights that help traders stay ahead of the curve.


