Sharp move coming in the S&P 500 according to this bear market leading indicator? [Video]
Watch the video from the WLGC session on 14 Jan 2025 to find out the following:
-
How to use the this leading indicator to "predict" the S&P 500 movement.
-
How to adopt the structure analysis in 2019 and 2022 in the current S&P 500 structure.
-
The subtle weakness in the current market based on the price volume analysis.
-
and a lot more.
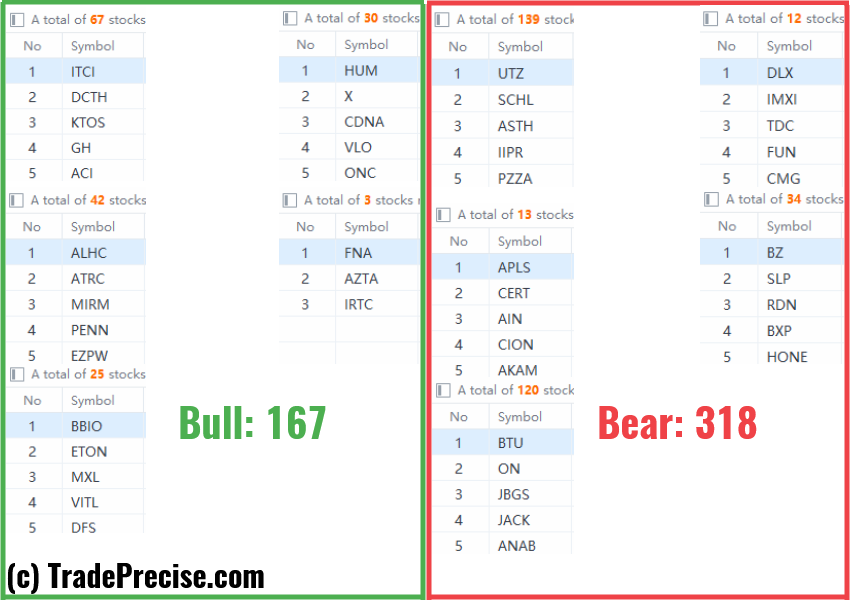
Market environment
The bullish vs. bearish setup is 167 to 318 from the screenshot of my stock screener below.
Three stocks ready to soar
11 actionable setups such as GEV, UGI, GEO were discussed during the live session before the market open (BMO).
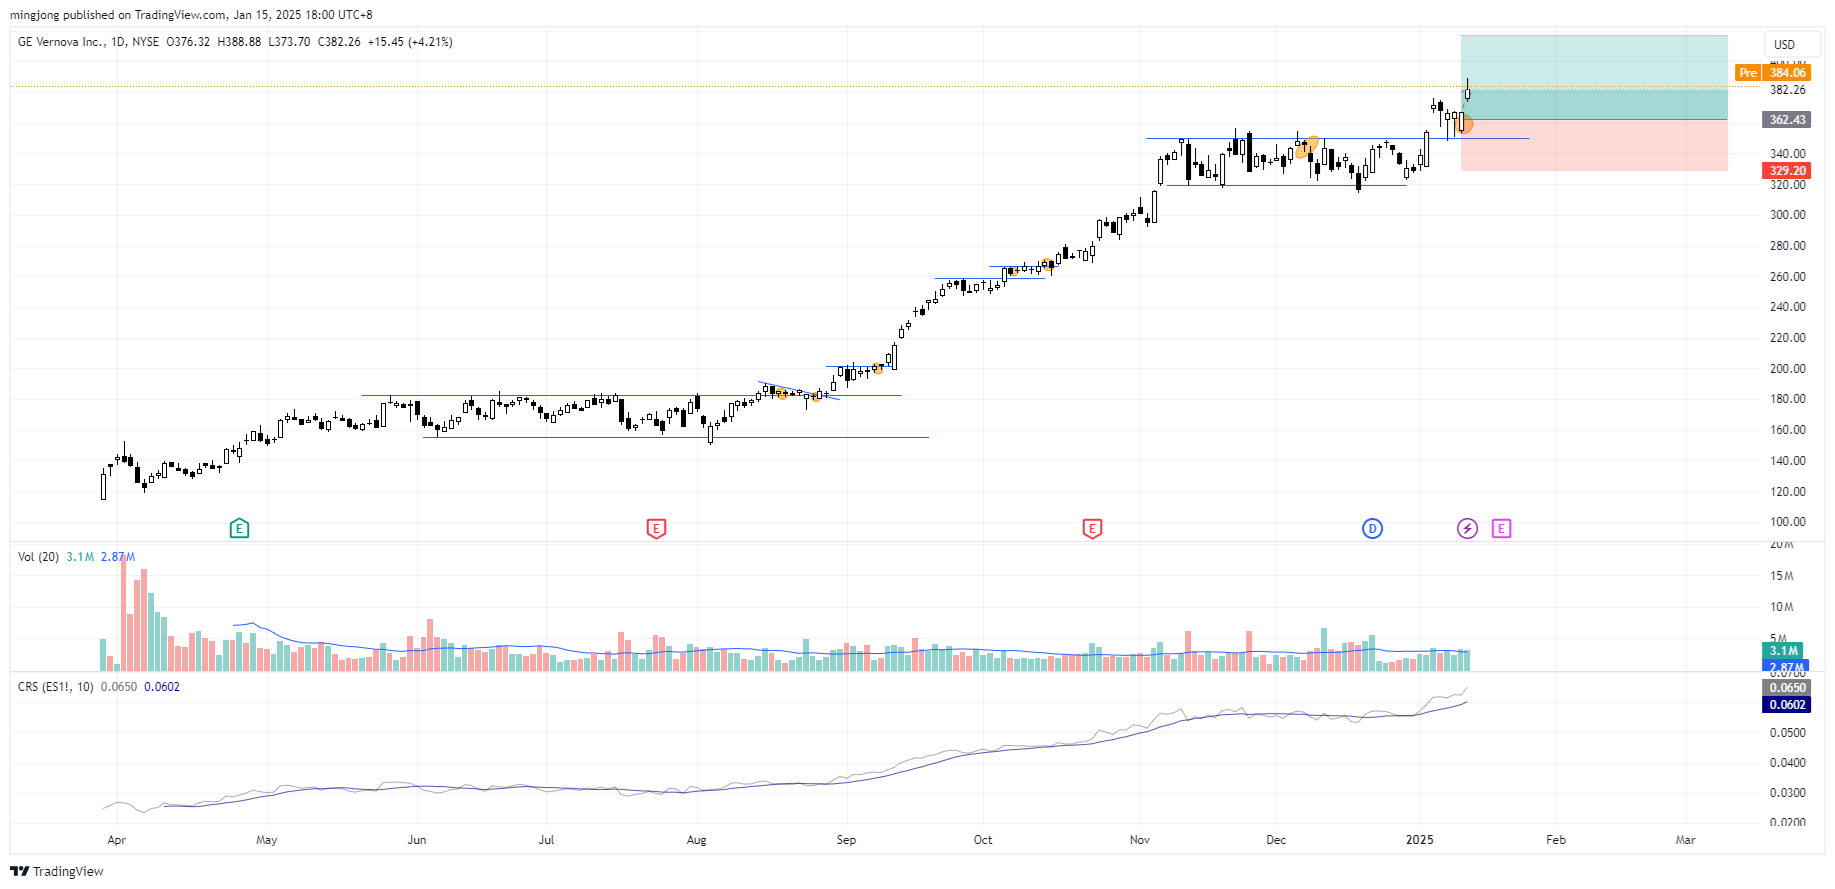
GE Vernova (GEV)
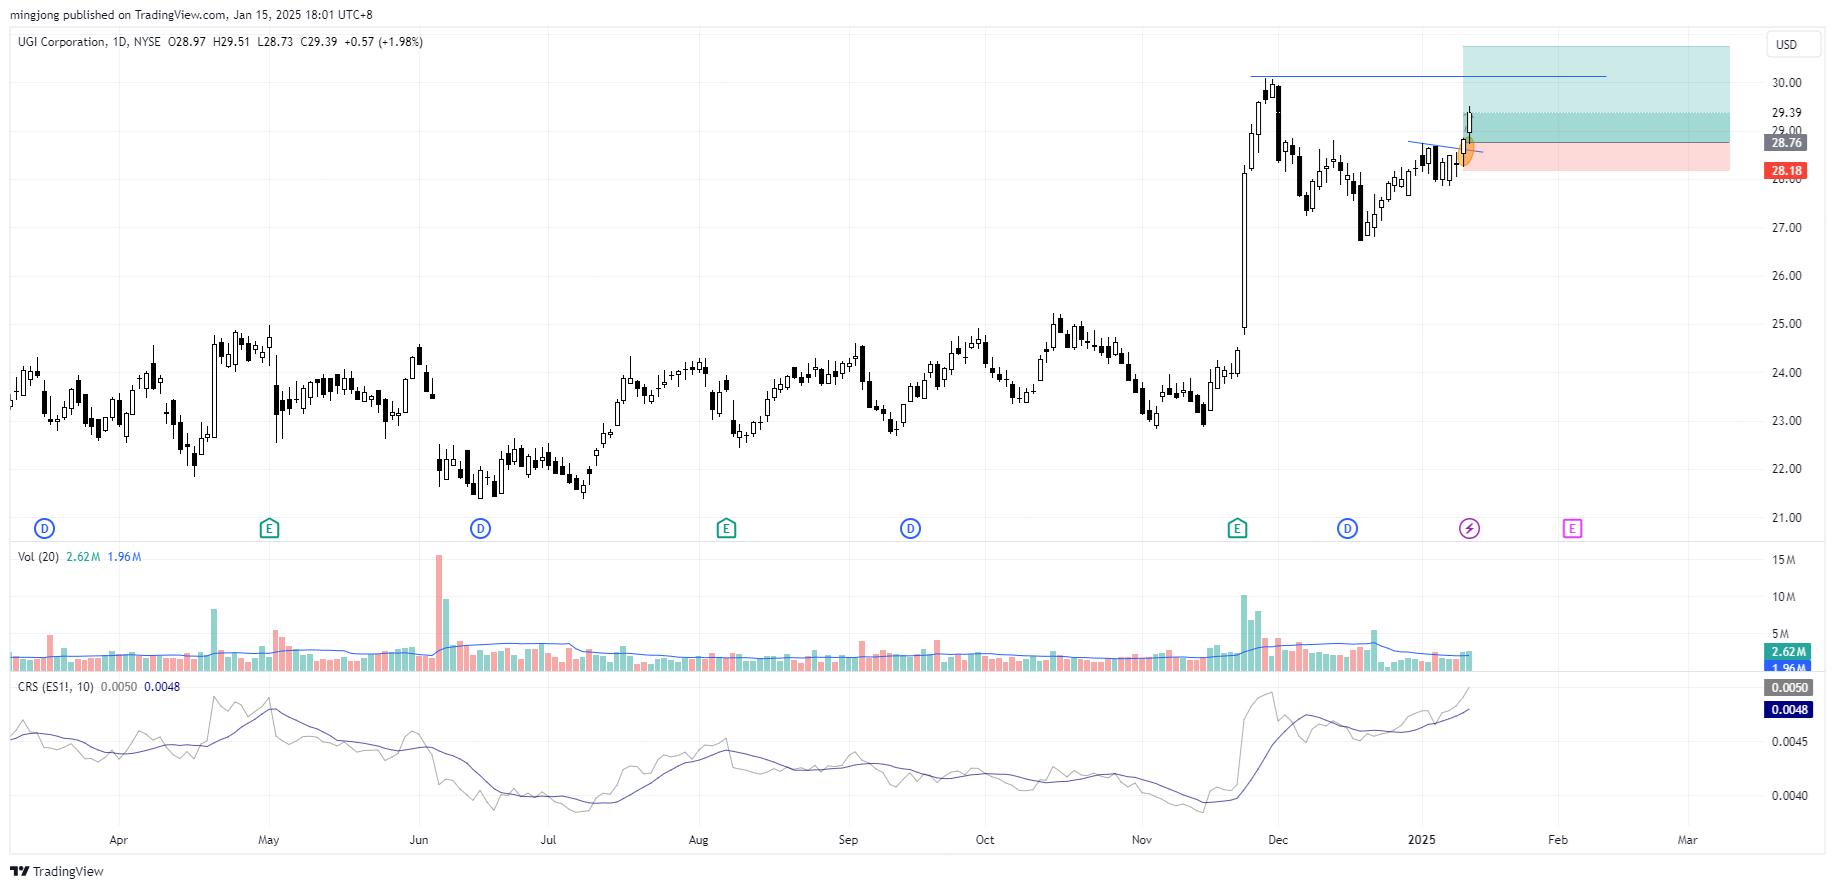
UGI Corporation (UGI)
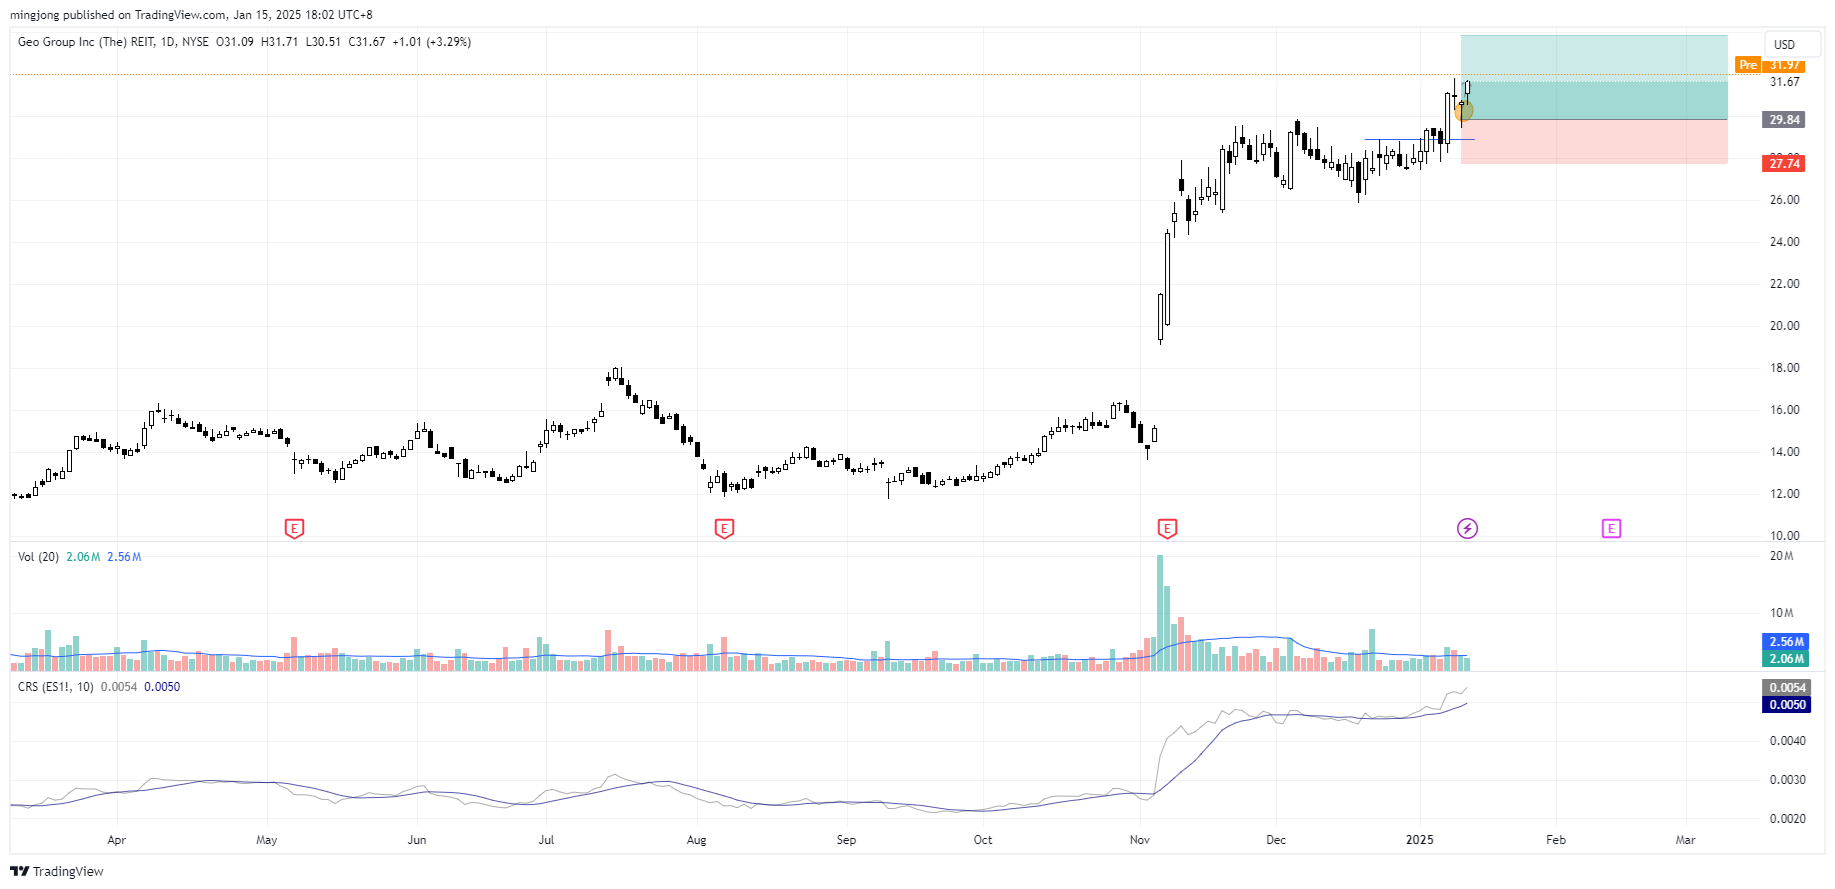
Geo Group (The) REIT (GEO)
Author

Ming Jong Tey
Independent Analyst
Ming Jong Tey has been trading since 2008. He started his learning journey from technical analysis (indicators, Fibonacci, etc...) to value investing. Throughout his journey, he develops an interest in price action with chart pattern trading.


