Shanghai Composite Index wave technical analysis [Video]
![Shanghai Composite Index wave technical analysis [Video]](https://editorial.fxsstatic.com/images/i/Economic-Indicator_Recession-5.png)
Shanghai Composite Wave technical analysis
Function: Counter Trend.
Mode: Corrective.
Structure: Gray wave 2.
Position: Orange wave 3.
Direction next higher degrees: Gray wave 3.
Details: Gray wave 1 appears to be completed; gray wave 2 of 3 is now developing.
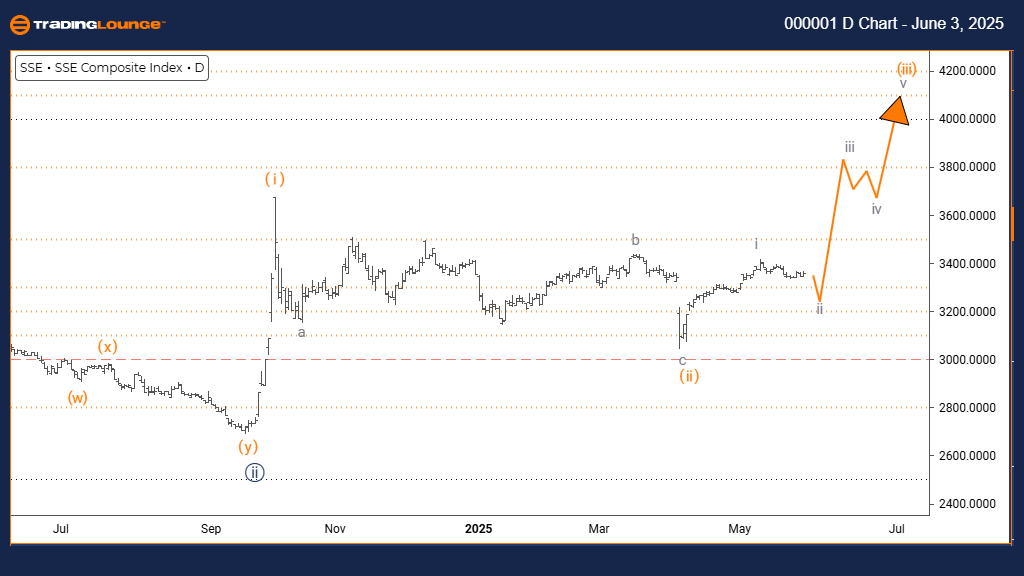
The daily chart outlines a counter-trend corrective phase for the Shanghai Composite Index, set within a broader bullish market formation. The analysis identifies the development of gray wave two within the ongoing formation of orange wave three. This suggests the initial advance of gray wave one has ended, leading to a temporary retracement, commonly viewed as a setup for a future bullish continuation.
The end of gray wave one confirms entry into a corrective phase with gray wave two. This phase is characterized by limited downside, assuming key support levels hold. The broader structure still favors an eventual move higher into gray wave three. This technical configuration gives investors valuable context regarding the current market phase.
The current wave pattern suggests that the index may undergo short-term volatility while completing gray wave two. This is seen as a brief pause within a larger advancing pattern. Investors should closely monitor price behavior for signs of wave two ending, which would point to the beginning of wave three. This wave setup frames both the current corrective conditions and the expected bullish continuation.
Traders should stay alert for new patterns that might clarify upcoming movements and manage their risk cautiously. The prevailing decline is considered a pullback in a larger bullish context, not the start of a new bearish trend.
Day chart
Shanghai Composite Wave technical analysis
Function: Bullish Trend.
Mode: Impulsive.
Structure: Orange wave 3.
Position: Navy blue wave 3.
Direction next higher degrees: Orange wave 3 (in progress).
Details: Orange wave 2 appears complete; now orange wave 3 of 3 is in play.
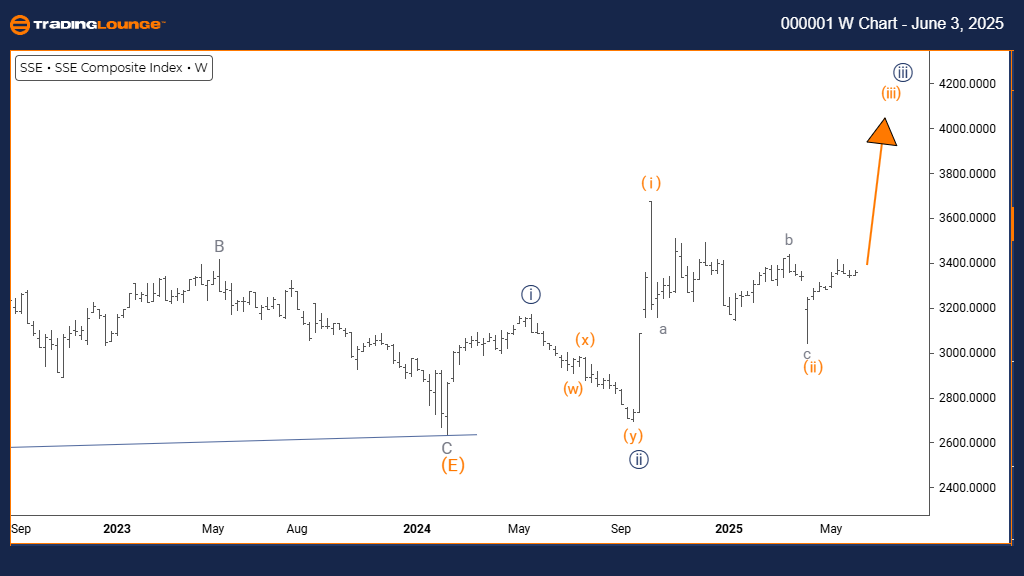
The weekly chart analysis presents a strong bullish perspective on the Shanghai Composite Index, with clear impulsive movement in the current wave structure. The chart identifies orange wave three forming within the broader bullish framework of navy blue wave three. This indicates orange wave two has ended and the index is now moving into the most dynamic part of an impulse wave sequence.
The analysis confirms orange wave two's conclusion and the transition into wave three’s advance. This impulsive trend is driven by notable buying pressure. On a weekly scale, this phase could continue for a significant period, suggesting long-term growth potential. Investors gain important insights from this positioning within a bullish market cycle.
The current pattern implies that the Shanghai Composite is in a highly favorable stage for trend traders, with orange wave three typically delivering strong price advances. Price movements should be monitored for trend continuation signals, and risk parameters should be managed carefully. The overall setup points toward sustained upside potential.
This weekly outlook highlights the likely strength and longevity of the upward movement. Being in navy blue wave three, this trend is part of a larger bullish cycle with further upside likely before the next correction. Traders are encouraged to seek quality entry points while remaining aligned with the wave structure.
Weekly chart
Shanghai Composite Index Wave technical analysis [Video]
Author

Peter Mathers
TradingLounge
Peter Mathers started actively trading in 1982. He began his career at Hoei and Shoin, a Japanese futures trading company.


