SGX TSI Iron Ore Elliott Wave analysis [Video]
![SGX TSI Iron Ore Elliott Wave analysis [Video]](https://editorial.fxsstatic.com/images/i/General-Stocks_3.png)
SGX TSI Iron Ore Elliott Wave analysis
SGX TSI Iron Ore CFR China (62% Fe Fines) index futures
The SGX TSI Iron Ore Futures contract is a key derivative on the Singapore Exchange (SGX), tracking iron ore delivered to China with 62% iron content. This contract is globally recognized as a pricing benchmark for the iron ore market.
Market context and recent price behavior
Since October 2024, the SGX TSI has exhibited choppy price movement. After a strong rebound during that month, the index began correcting the prior rally. The current price action indicates that the market is forming a potential structure that may lead to further swings in both directions in the weeks ahead.
SGX TSI daily chart analysis
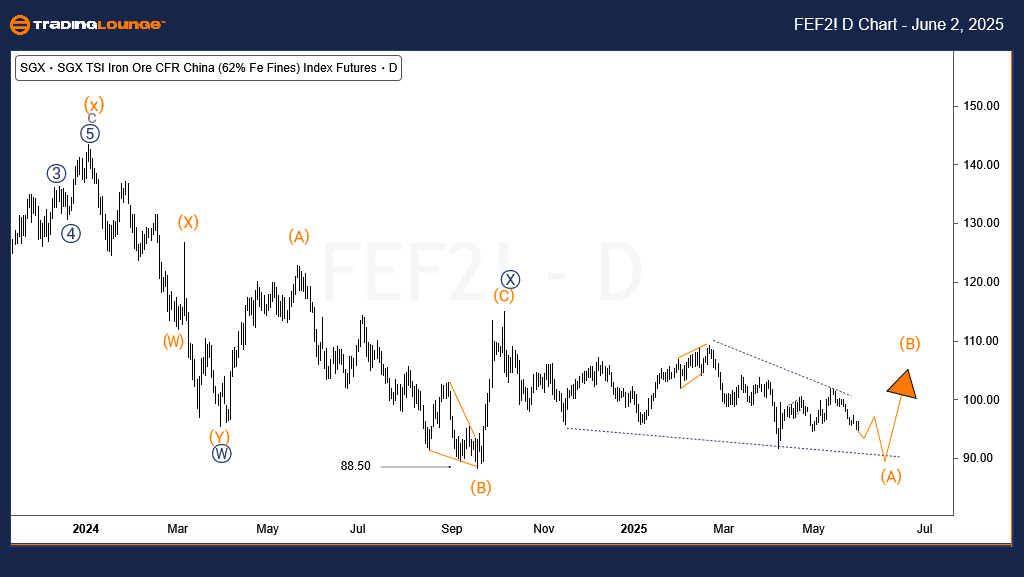
From the long-term perspective, the index is shaping a double zigzag correction from its peak in May 2021, when it hit approximately $234. A sharp decline followed, bringing the price down to around $74 by October 2022. That initial selloff completed a zigzag formation.
The rally that followed formed another zigzag, topping out in January 2024 at $153.5. Since then, the index has resumed a downward move in yet another zigzag pattern. Together, these moves define a large-scale (w)-(x)-(y) corrective structure. The current wave (y) appears incomplete, and projections indicate it may extend toward the $45 level in the coming weeks or months.
SGX TSI Four-hour chart analysis
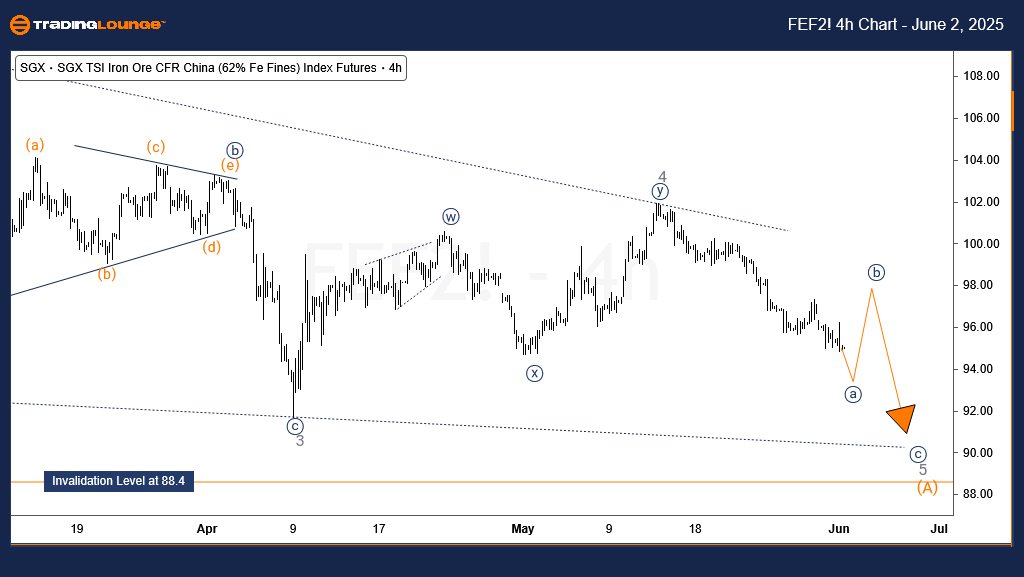
On the H4 chart, the decline from October 2024 is taking shape as a leading diagonal, forming wave (A) of ((Y)) of w of (y). Once this diagonal concludes, a corrective rally in wave (B) is anticipated, followed by another decline forming wave (C) of ((Y)). This pattern supports a bearish outlook, particularly while price remains below the key resistance levels of $115 and $143.5.
Traders should expect downward continuation following corrective bounces and monitor price action near these critical resistance levels for confirmation of further declines.
SGX TSI Iron Ore Elliott Wave analysis [Video]
Author

Peter Mathers
TradingLounge
Peter Mathers started actively trading in 1982. He began his career at Hoei and Shoin, a Japanese futures trading company.














