|

SanDisk (NASDAQ: SNDK) bullish path beyond $440

SanDisk (NASDAQ: SNDK) surged over 1000% since its IPO last year and it shows no signs of slowing. Today, we decode the Elliott Wave structure behind its powerful breakout. Consequently, our analysis charts a precise path to higher targets. This technical blueprint reveals a compelling setup fueled by pure momentum.

Elliott Wave analysis

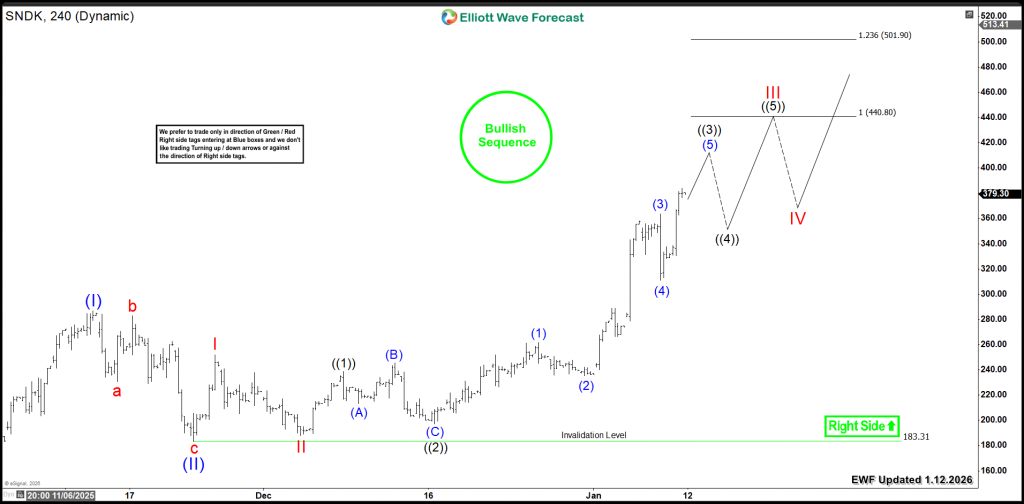
SNDK rallied from its April 2025 low in a strong impulse. This move marked Wave I at $286 in November 2025. Subsequently, a three-wave pullback formed Wave II at $183. Then, the stock turned higher again in a powerful Wave III. This wave broke into new all-time highs within a nesting structure.

Currently, the bullish sequence remains incomplete. Therefore, the stock should continue rallying toward the $440 – $501 target zone. This advance will unfold through a series of third and fourth waves.

Consequently, we expect all short-term SNDK pullbacks to find buyers. These corrections will form as 3, 7, or 11 swings. The primary daily cycle remains active. Ultimately, this should propel prices beyond the $500 level.

SNDK four-hour chart 1.12.2026

Chart

Conclusion

SNDK’s bullish cycle maintains its strength. Consequently, traders should focus on strategic entries during daily pullbacks. Apply our Elliott Wave methodology for exact timing. More precisely, enter the market after a 3, 7, or 11-swing correction finishes. Additionally, our proprietary Blue Box system pinpoints high-probability entry zones. Consequently, this disciplined method provides clarity and confidence. Ultimately, it positions traders to capture the next major bullish leg.

Author

Elliott Wave Forecast Team

Elliott Wave Forecast Team

ElliottWave-Forecast.com

More from Elliott Wave Forecast Team
Share:

Editor's Picks

EUR/USD flirts with daily highs, retargets 1.1900

EUR/USD regains upside traction, returning to the 1.1880 zone and refocusing its attention to the key 1.1900 barrier. The pair’s slight gains comes against the backdrop of a humble decline in the US Dollar as investors continue to assess the latest US CPI readings and the potential Fed’s rate path.

GBP/USD remains well bid around 1.3650

GBP/USD maintains its upside momentum in place, hovering around daily highs near 1.3650 and setting aside part of the recent three-day drop. Cable’s improved sentiment comes on the back of the Greenback’s  irresolute price action, while recent hawkish comments from the BoE’s Pill also collaborate with the uptick.

Gold clings to gains just above $5,000/oz

Gold is reclaiming part of the ground lost on Wednesday’s marked decline, as bargain-hunters keep piling up and lifting prices past the key $5,000 per troy ounce. The precious metal’s move higher is also underpinned by the slight pullback in the US Dollar and declining US Treasury yields across the curve.

Crypto Today: Bitcoin, Ethereum, XRP in choppy price action, weighed down by falling institutional interest 

Bitcoin's upside remains largely constrained amid weak technicals and declining institutional interest. Ethereum trades sideways above $1,900 support with the upside capped below $2,000 amid ETF outflows.

Week ahead – Data blitz, Fed Minutes and RBNZ decision in the spotlight

US GDP and PCE inflation are main highlights, plus the Fed minutes. UK and Japan have busy calendars too with focus on CPI. Flash PMIs for February will also be doing the rounds. RBNZ meets, is unlikely to follow RBA’s hawkish path.

Ripple Price Forecast: XRP potential bottom could be in sight

Ripple edges up above the intraday low of $1.35 at the time of writing on Friday amid mixed price actions across the crypto market. The remittance token failed to hold support at $1.40 the previous day, reflecting risk-off sentiment amid a decline in retail and institutional sentiment.