|

Royal Gold (RGLD) bullish nest for a break above $200.00

Royal Gold (NASDAQ: RGLD), founded in 1991, is a global leader in precious metals royalty and streaming. With interests in 194 properties across 20+ countries, it manages gold, silver, copper, lead, and zinc assets. This article evaluates its bullish Elliott Wave framework and highlights potential paths for further growth.

Following 5 years of consolidation in a sideways range, RGLD has decisively surged to new all-time highs within a robust impulsive wave (III) structure. The weekly chart reveals a nesting formation to the upside, therefore, it’s suggesting a third wave extension is likely to unfold, reinforcing the stock’s bullish trajectory.

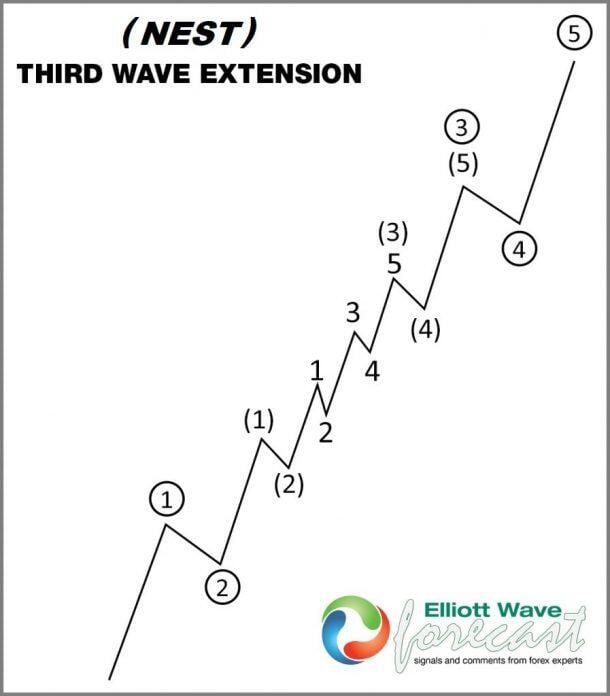
The chart below illustrates the Nest formation, showcasing the I-II series leading up to the wave III extension. Certainly, identifying and capitalizing on a breakout within a nest is among the most rewarding opportunities for Elliott Wave traders.

Third Wave extension

Chart

RGLD weekly chart

Chart

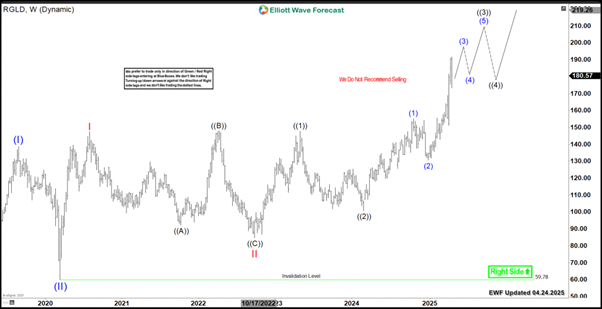
RGLD is expected to continue its rally through a series of 4th and 5th waves, completing its entire cycle from 2020 within a 5-wave advance above $200. Once this cycle concludes, a larger degree correction is anticipated. In the meantime, we expect the daily pullback to remain supported. After that, buyers are likely to seek long entries, positioning themselves against the December 2024 low of $130.6. This level serves as a critical support point in the ongoing bullish progression.

Author

Elliott Wave Forecast Team

Elliott Wave Forecast Team

ElliottWave-Forecast.com

More from Elliott Wave Forecast Team
Share:

Markets move fast. We move first.

Orange Juice Newsletter brings you expert driven insights - not headlines. Every day on your inbox.

By subscribing you agree to our Terms and conditions.

Editor's Picks

EUR/USD climbs toward 1.1800 on broad USD weakness

EUR/USD gathers bullish momentum and advances toward 1.1800 in the second half of the day on Tuesday. The US Dollar weakens and helps the pair stretch higher after the employment report showed that Nonfarm Payrolls declined by 105,000 in October before rising by 64,000 in November.

GBP/USD climbs to fresh two-month high above 1.3400

GBP/USD gains traction in the American session and trades at its highest level since mid-October above 1.3430. The British Pound benefits from upbeat PMI data, while the US Dollar struggles to find demand following the mixed employment figures and weaker-than-forecast PMI prints, allowing the pair to march north.

Gold extends its consolidative phase around $4,300

Gold trades in positive above $4,300 after spending the first half of the day under bearish pressure. XAU/USD capitalizes on renewed USD weakness after the jobs report showed that the Unemployment Rate climbed to 4.6% in November and the PMI data revealed a loss of growth momentum in the private sector in December. 

US Retail Sales virtually unchanged at $732.6 billion in October

Retail Sales in the United States were virtually unchanged at $732.6 billion in October, the US Census Bureau reported on Tuesday. This print followed the 0.1% increase (revised from 0.3%) recorded in September and came in below the market expectation of +0.1%.

Ukraine-Russia in the spotlight once again

Since the start of the week, gold’s price has moved lower, but has yet to erase the gains made last week. In today’s report we intend to focus on the newest round of peace talks between Russia and Ukraine, whilst noting the release of the US Employment data later on day and end our report with an update in regards to the tensions brewing in Venezuela.

BNB Price Forecast: BNB slips below $855 as bearish on-chain signals and momentum indicators turn negative

BNB, formerly known as Binance Coin, continues to trade down around $855 at the time of writing on Tuesday, after a slight decline the previous day. Bearish sentiment further strengthens as BNB’s on-chain and derivatives data show rising retail activity.