|

Royal Caribbean Cruises (NYSE: RCL) super bullish nest in progress

Royal Caribbean Cruises Ltd (NYSE: RCL), is one of the best performing stocks in recent years with +1300% up from 2020 lows. In our previous article, we identified the initial bullish structure setting up the current rally. Likewise, we’ll continue exploring the weekly path based on Elliott Wave Theory.

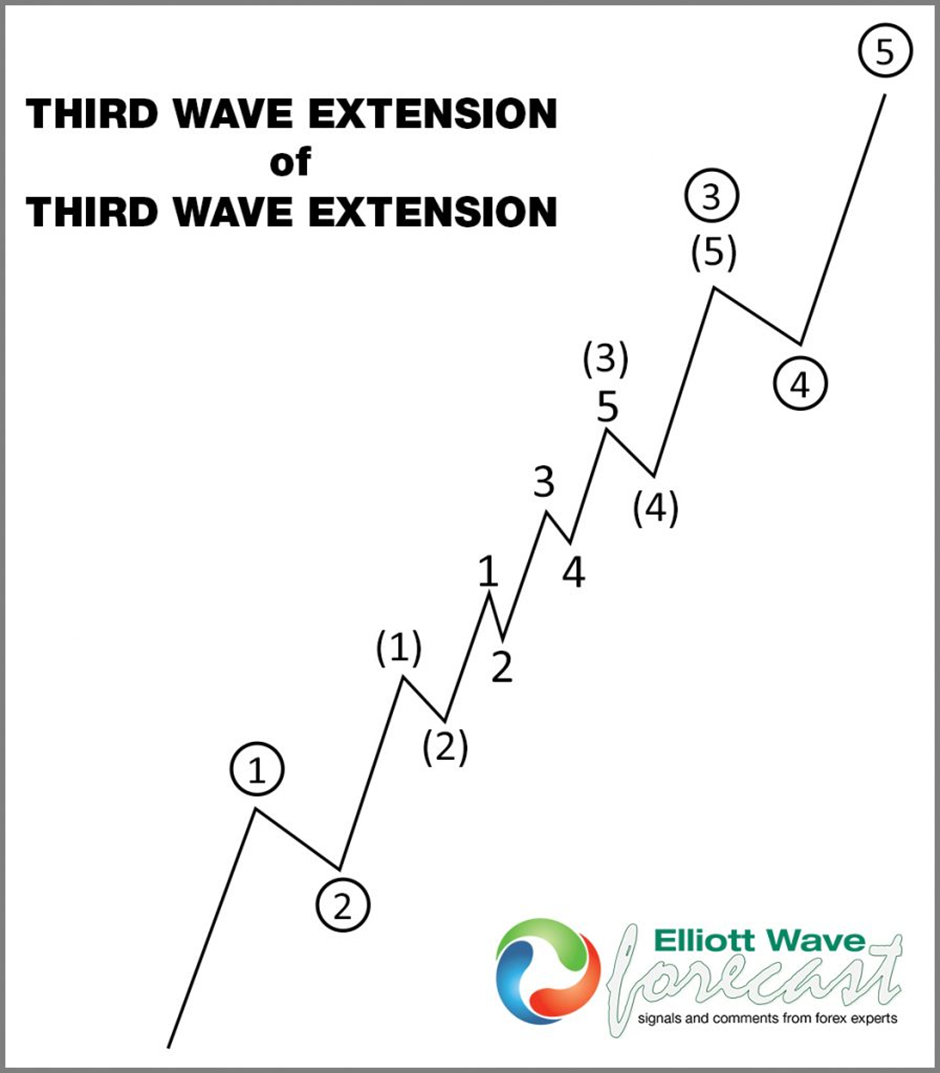
In 2023, we explained that RCL was in the process of creating a bullish Nest from 2020 low and it needed to break above 2021 peak to confirm the higher high sequence. A nest is a series of 1-2 and most of the time it happens before a huge move takes place resulting in an extended move. The below chart shows what a nest looks like within a third wave.

Third wave extension

Chart

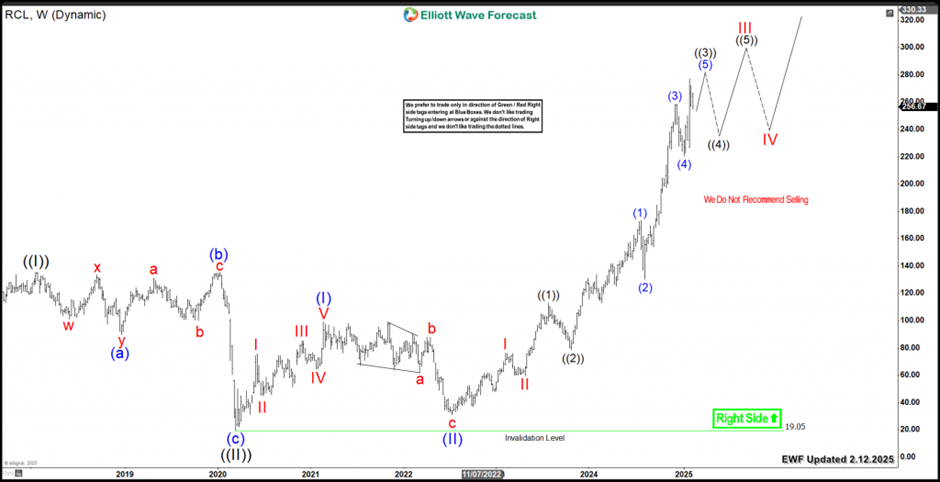
RCL rallied into new all time highs after breaking above 2018 peak, as a result, it established a higher high sequence within its Grand super cycle. The stock exceeded the 1.618 Fibonacci extension level $250 which confirms the extended wave ((III)) and it supports the continuation to the upside. After that, RCL can see further extension toward $301 – $385 within a series of 4th & 5th waves.

Consequently, the current incomplete bullish sequence is still supporting the weekly rally and suggest that RCL will continue to find buyers during pullbacks in 3 , 7 or 11 swings until it ends 5 waves advance within cycle from 2020 to end wave ((III)). In conclusion, Royal Caribbean Cruises is looking for a continued upward trajectory within its weekly cycle and dips should provide valuable buying opportunities for long term investors.

RCL weekly chart 2.12.2025

Chart

Author

Elliott Wave Forecast Team

Elliott Wave Forecast Team

ElliottWave-Forecast.com

More from Elliott Wave Forecast Team
Share:

Markets move fast. We move first.

Orange Juice Newsletter brings you expert driven insights - not headlines. Every day on your inbox.

By subscribing you agree to our Terms and conditions.

Editor's Picks

EUR/USD meets some support near 1.1670

EUR/USD further extends its bearish leg on Wednesday, coming under extra pressure and breaching below the 1.1700 level to flirt with four-week troughs in a context of marginal gains in the US Dollar ahead of the key US NFP on Friday.

GBP/USD deflates to daily lows near 1.3470

GBP/USD stays under pressure on Wednesday, dipping to fresh lows around 1.3470 and extending the pullback that began the previous session. Cable remains on the defensive, with the US Dollar nudging slightly higher in the wake of key US December data.

Gold remains offered near $4,450

Gold remains on the back foot on Wednesday, hovering around $4,450 per troy ounce after bringing a three-day rally to an end. The metal’s advance seems to have run out of steam near the $4,500 area, with a firmer US Dollar after key US data weighing on prices. Still, the downside looks limited for now, thanks to falling US Treasury yields across the curve.

XRP faces selling pressure as key on-chain metric resets and ETF inflows weaken

Ripple (XRP) is trading downward but holding support at $2.22 at the time of writing on Wednesday, as fear spreads across the cryptocurrency market, reversing gains made from the start of the year.

2026 economic outlook: Clear skies but don’t unfasten your seatbelts yet

Most years fade into the background as soon as a new one starts. Not 2025: a year of epochal shifts, in which the macroeconomy was the dog that did not bark. What to expect in 2026? The shocks of 2025 will not be undone, but neither will they be repeated.

XRP battles selling pressure as profit-taking, ETF inflows shape outlook

Ripple (XRP) is trading downward but holding support at $2.22 at the time of writing on Wednesday, as fear spreads across the cryptocurrency market, reversing gains made from the start of the year.