Riot Blockchain Stock Price and Forecast: Why is RIOT up?


  • RIOT rallies hard as Bitcoin bounce continues.
  • RIOT finished Monday up nearly 7% as Bitcoin pushes higher.
  • Bitcoin heads for $60,000 after stabilising above $55,000.

Crypto stocks were back on the rally train on Monday as Bitcoin pushed close to $60,000 in the midst of some risk assets seeing renewed interest from retail traders. If and when retail traders return to the market, it is the riskier assets they seem to target such as meme stocks and Bitcoin and other cryptocurrencies. The relief rally in Bitcoin was sparked last week by comments from Fed Reserve Chair Jerome Powell, who said there were no plans to ban Bitcoin. This sent Bitcoin on a charge straight for $55,000  and now looks set to target the $60,000 psychological level.

Crypto stocks have naturally been a big beneficiary, and most were up sharply yesterday. RIOT was up nearly 7% on the day and closed at $27.63, having touched $28.90 earlier in the session. The Bitcoin chart below shows the continuing strength and potential move to $60,000.

RIOT stock news

On Tuesday, October 5, RIOT released September production numbers and operations updates. The headline was strong with a yearly increase in production of 346%. In September 2021 RIOT Blockchain produced 406 BTC compared to 91 BTC in the same month a year earlier. As of September 30, 2021, RIOT said it holds approximately 3,534 BTC, all of which are from its own mining operations. The company currently has 25,646 miners with a hash rate capacity of 2.6 exahash per second. RIOT aims to increase this to 7.7 exahash per second by Q4 2022. 

Market Cap $2.5 billion
Enterprise Value $3.15 billion
Price/Earnings (P/E) 81

Price/Book

7.5
Price/Sales 89
Gross Margin 46%
Net Margin 45%
EBITDA $28 million
52 week high $ 79.5
52 week low $2.96
Short Interest 19%
Average Wall Street rating and price target

Buy $54


RIOT stock forecast

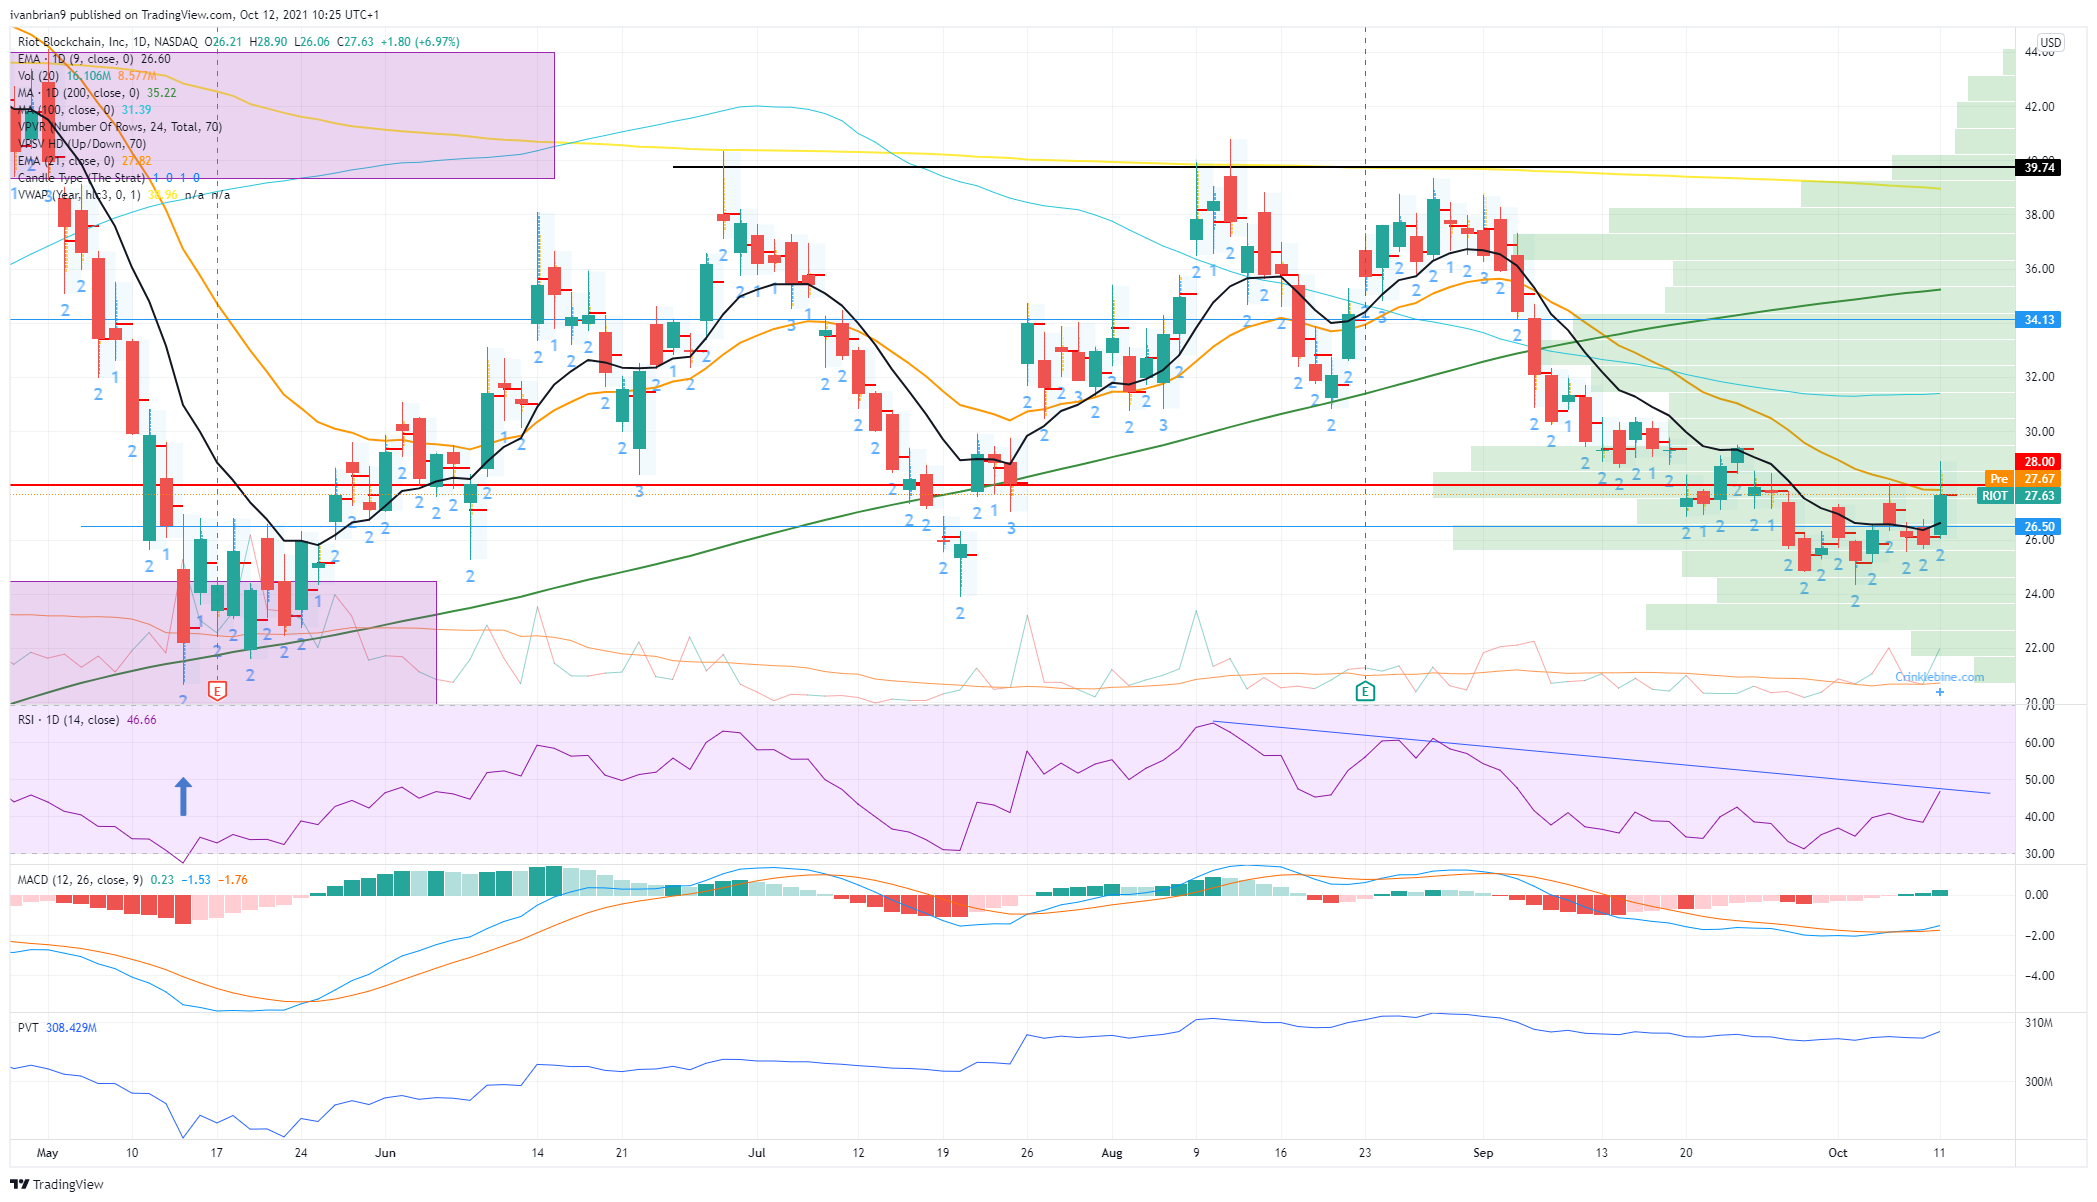
We had put this one on watch for a strong breakout with confirmation from the momentum oscillators. That is exactly what we got with a powerful move on Monday seeing the Moving Average Convergence Divergence (MACD) cross over and give us a bullish signal. The Relative Strength Index (RSI) has picked up but is still below 50 and has not broken the downtrend line. Getting above $27 has put RIOT into neutral, but the stock needs to get above $30 to turn bullish. This will create a higher high than the previous one on September 23. A pullback after such a strong move is ok so long as RIOT stock remains above $26.50.

FXStreet View: Neutral, bullish above $30.

FXStreet Ideas: Look to buy a pullback above $26.50 or buy a breakout above $30. Please use stops.


Share: Feed news

Information on these pages contains forward-looking statements that involve risks and uncertainties. Markets and instruments profiled on this page are for informational purposes only and should not in any way come across as a recommendation to buy or sell in these assets. You should do your own thorough research before making any investment decisions. FXStreet does not in any way guarantee that this information is free from mistakes, errors, or material misstatements. It also does not guarantee that this information is of a timely nature. Investing in Open Markets involves a great deal of risk, including the loss of all or a portion of your investment, as well as emotional distress. All risks, losses and costs associated with investing, including total loss of principal, are your responsibility. The views and opinions expressed in this article are those of the authors and do not necessarily reflect the official policy or position of FXStreet nor its advertisers. The author will not be held responsible for information that is found at the end of links posted on this page.

If not otherwise explicitly mentioned in the body of the article, at the time of writing, the author has no position in any stock mentioned in this article and no business relationship with any company mentioned. The author has not received compensation for writing this article, other than from FXStreet.

FXStreet and the author do not provide personalized recommendations. The author makes no representations as to the accuracy, completeness, or suitability of this information. FXStreet and the author will not be liable for any errors, omissions or any losses, injuries or damages arising from this information and its display or use. Errors and omissions excepted.

The author and FXStreet are not registered investment advisors and nothing in this article is intended to be investment advice.

Recommended content


Recommended content

Editors’ Picks

AUD/USD failed just ahead of the 200-day SMA

AUD/USD failed just ahead of the 200-day SMA

Finally, AUD/USD managed to break above the 0.6500 barrier on Wednesday, extending the weekly recovery, although its advance faltered just ahead of the 0.6530 region, where the key 200-day SMA sits.

AUD/USD News

EUR/USD met some decent resistance above 1.0700

EUR/USD met some decent resistance above 1.0700

EUR/USD remained unable to gather extra upside traction and surpass the 1.0700 hurdle in a convincing fashion on Wednesday, instead giving away part of the weekly gains against the backdrop of a decent bounce in the Dollar.

EUR/USD News

Gold keeps consolidating ahead of US first-tier figures

Gold keeps consolidating ahead of US first-tier figures

Gold finds it difficult to stage a rebound midweek following Monday's sharp decline but manages to hold above $2,300. The benchmark 10-year US Treasury bond yield stays in the green above 4.6% after US data, not allowing the pair to turn north.

Gold News

Bitcoin price could be primed for correction as bearish activity grows near $66K area

Bitcoin price could be primed for correction as bearish activity grows near $66K area

Bitcoin (BTC) price managed to maintain a northbound trajectory after the April 20 halving, despite bold assertions by analysts that the event would be a “sell the news” situation. However, after four days of strength, the tables could be turning as a dark cloud now hovers above BTC price.

Read more

Bank of Japan's predicament: The BOJ is trapped

Bank of Japan's predicament: The BOJ is trapped

In this special edition of TradeGATEHub Live Trading, we're joined by guest speaker Tavi @TaviCosta, who shares his insights on the Bank of Japan's current predicament, stating, 'The BOJ is Trapped.' 

Read more

Forex MAJORS

Cryptocurrencies

Signatures