Rigetti Computing hit target, what is next?

RGTI has risen rapidly in value in recent days attracting the attention of investors. Here we have the 15-minute chart. Applying the Elliott Waves principle, the stock should find support in 5.89 – 7.07 area to complete a wave 4. This would generate a new rally on wave 5 that could reach around 8.94 – 10.25 or extend higher.
RGTI 15 min chart 12.11.2024
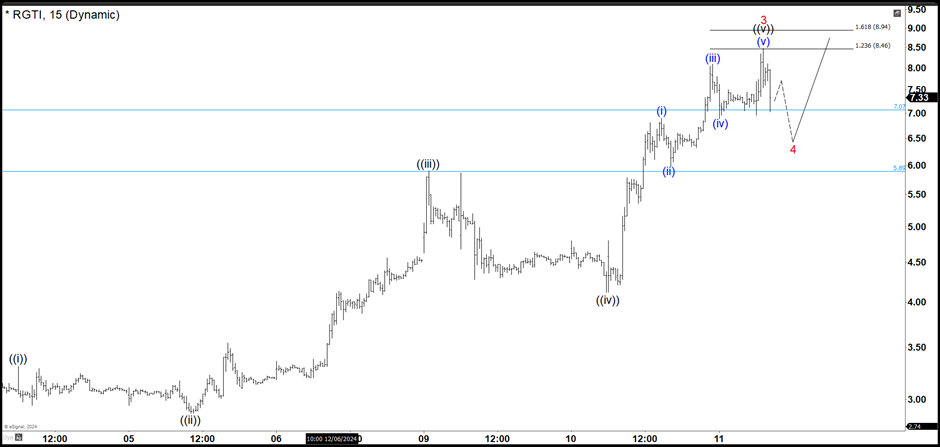
In any case, as long as the market respects the 5.89 – 7.07 area, RGTI must continue with the upward movement and break above wave 3 to reach at least 8.94 – 10.25. If the market closes below 5.89, it would open the possibility that the value of the stock will drop to 4.00 before looking for another move higher.
RGTI five min chart 12.11.2024 (market closed)
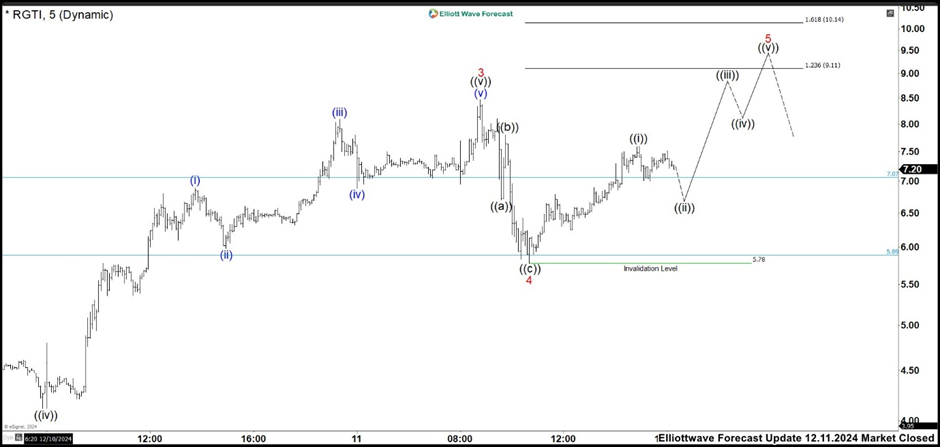
RGTI found support at 5.78 low and rallied. From here, we are looking to build an impulse structure as wave 5. Wave ((i)) could be completed already and while the pullback as wave ((ii)) is above 5.78 low, RGTI should continue higher. The target for this wave 5 comes in 9.11 -10.14 if there is not more extension in the rally.
RGTI 30 min chart 12.20.2024
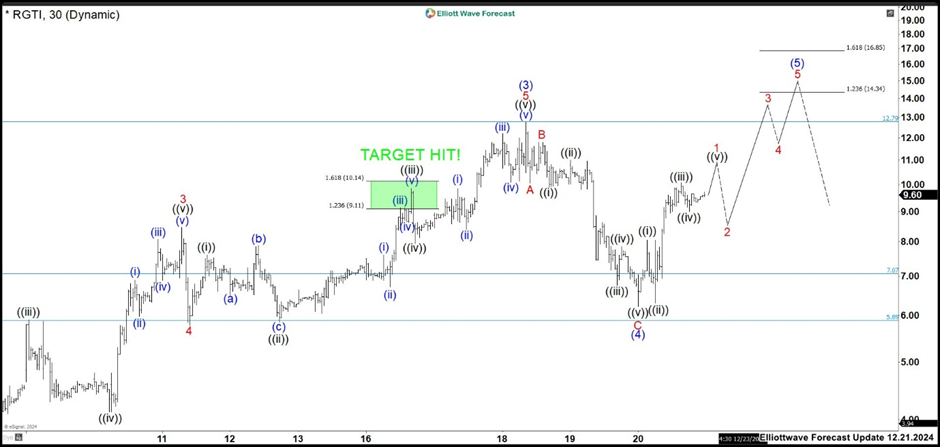
We can see in the chart how was the formation process of the impulse as wave 5. Wave ((ii)) did an expanded flat correction that was very deep, almost breaking the invalidation price. In the rally, we see 5 waves reaching the expected zone of 9.11 – 10.14 completing wave ((iii)). This should have given us a clue that the market still needed one more high to finish the wave 5 impulse. And so it was! After the correction of wave ((iv)), Rigetti built an extended wave ((v)) to finish wave 5 at 12.75 high. The truth is that I would not have considered an extended wave ((v)), I would have considered a value of 11.05 to complete wave ((v)).
The rally also completed wave (3) and the market reacted downwards returning to the support zone of 5.78 – 7.07 finishing wave (4). As long as the market does not close below this area, RGTI should continue to rise in the short term. With a close below this area, we must reanalyze the market structure. For now, we should focus on looking for more bullish movement that reaches the 14.34 – 16.85 area, if there are no further extensions, to finish wave (5).
Author

Elliott Wave Forecast Team
ElliottWave-Forecast.com


