|

Riding the wave: $XLU’s impressive rally and what’s coming next part two

In today’s article, we will follow up on the past performance of the SPDR Utilities Select Sector ETF ($XLU) forecast. We will also review the latest weekly count. First, let’s take a look at how we analyzed it back in October 2023.

$XLU weekly Elliott Wave view – October 2023
XLU

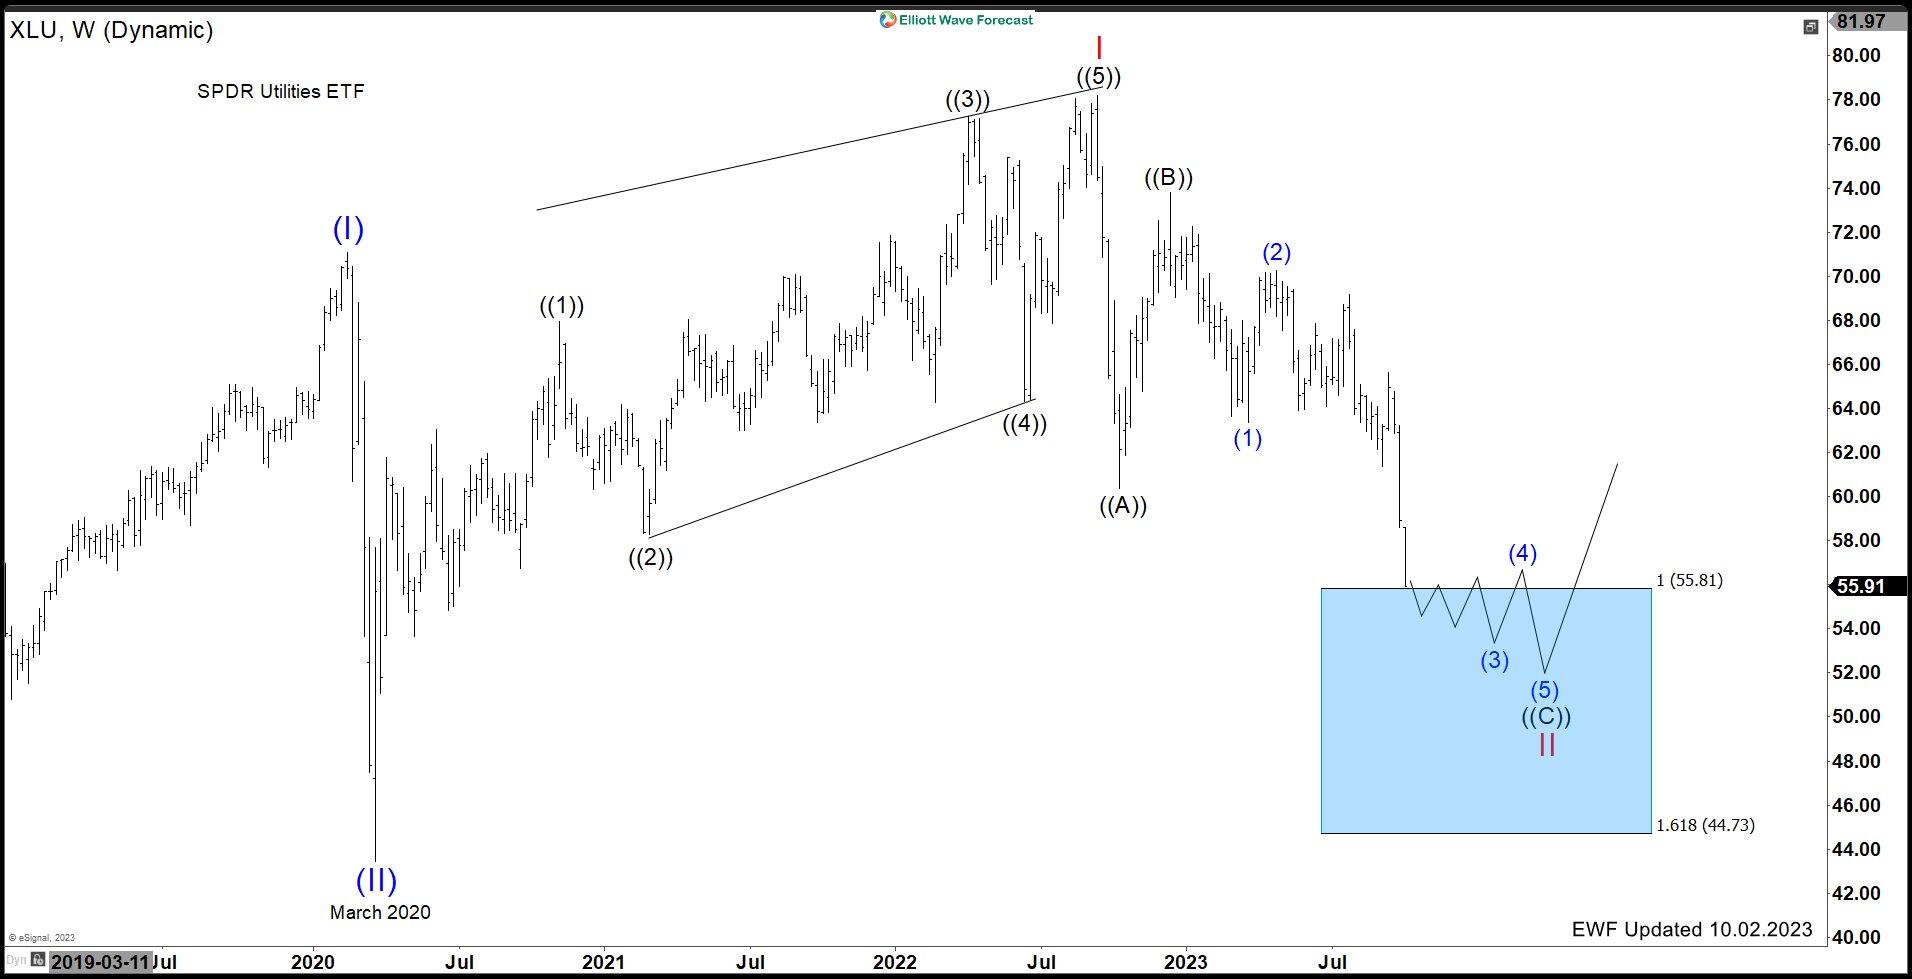
In October 2023, we explained that $XLU had reached the Blue Box area at $55.81 – $44.73. A bounce was anticipated at this level. This area was a critical support zone identified by our Elliott Wave analysis.

$XLU weekly Elliott Wave view – May 28, 2024
XLU

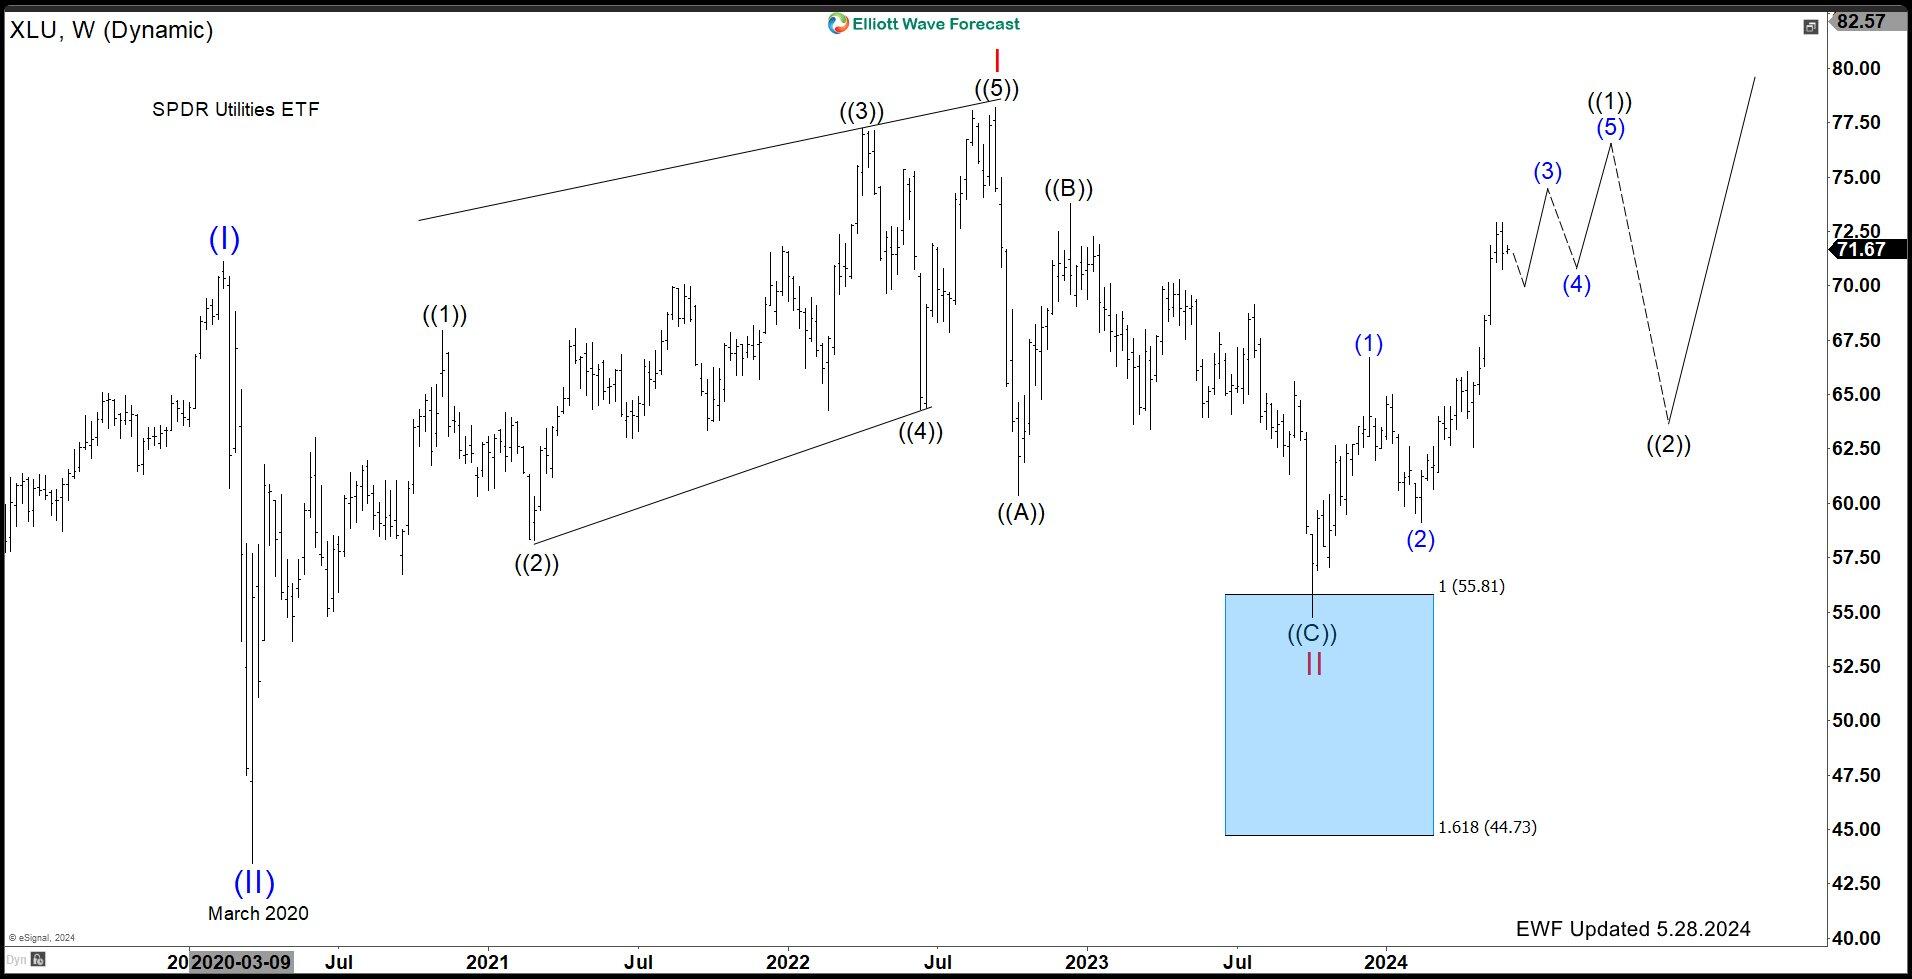
In May 2023, we explained that $XLU has bounced from the Blue Box area. As a result, the ETF has moved higher, allowing long positions to become risk-free. We expect $XLU to continue its rally towards the $74.00 – $79.00 range in a 5-wave pattern. This rally is favored to happen before another pullback occurs. Traders should look for re-entry opportunities at black ((2)) in 3 or 7 swings. Moreover, a break above the all-time highs (ATHs) will start a bullish sequence towards the $89 – $111 range.

$XLU weekly Elliott Wave view – Oct 07, 2024
Chart

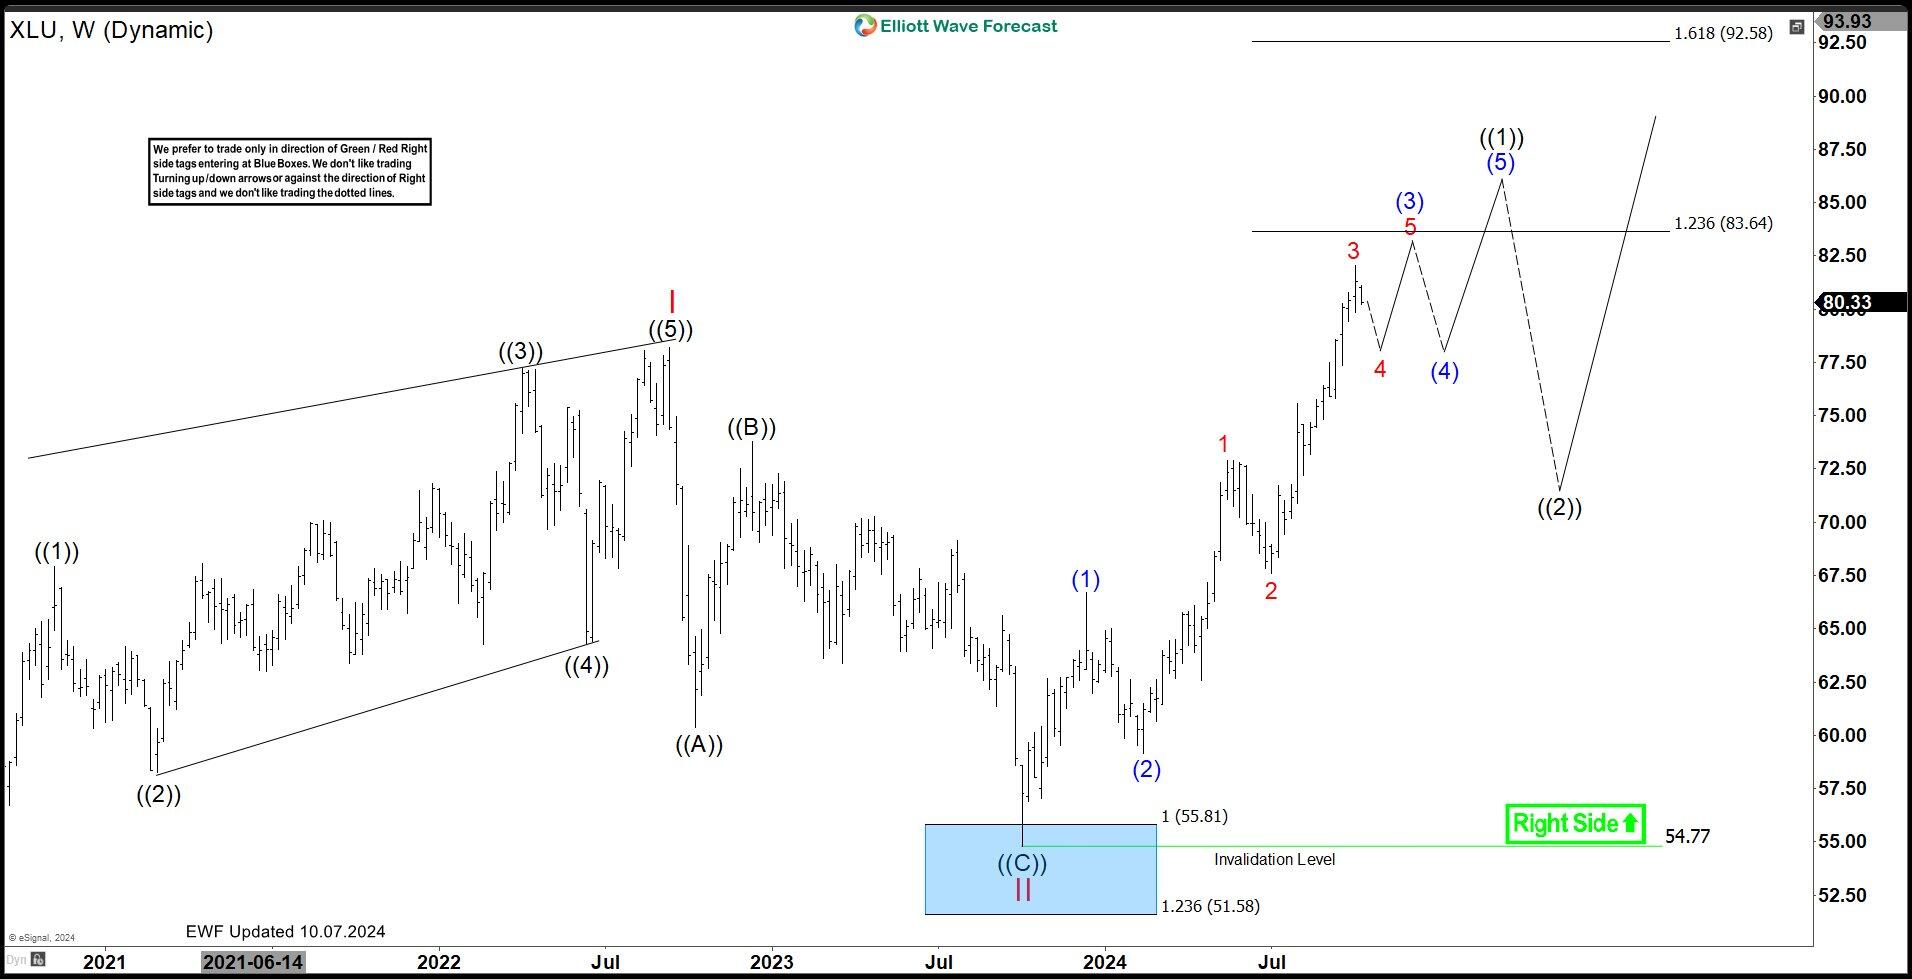
The latest weekly update is showing that the ETF has broke above the all-time highs. As a result, it has opened a bullish sequence. We expect The ETF to continue its rally towards the $83.64 – $92.58 range in a series of wave 4 and 5 pattern. Traders can look for re-entry opportunities at red 4 and blue (4) in 3 or 7 swings. Once the pattern is complete, a larger degree pullback in black ((2)) is expected to take place to correct the entire cycle from Oct 2023 low.

Author

Elliott Wave Forecast Team

Elliott Wave Forecast Team

ElliottWave-Forecast.com

More from Elliott Wave Forecast Team
Share:

Editor's Picks

GBP/USD holds range below 1.3650 amid Iran risks

GBP/USD extends its sideways consolidative price move for the second straight day and trades below 1.3650 in Tuesday's European session. The US Dollar is looking to build on its modest recovery amid US sanctions on Iran, acting as a headwind for the pair. The lack of follow-through selling warrants some caution for bearish traders.

EUR/USD struggles near 1.1650 as USD recovers amid Mideast woes

EUR/USD is struggling to gain traction, while trading near 1.1650 in European trading on Tuesday. The pair fails to find support amid a modest US Dollar recovery as rising oil prices, elevated bond yields, and escalating Middle East tensions fuel risk-off trades. Germany IFO Survey is next in focus.

Gold remains depressed below $4,650 on firmer USD, Fed risks, and Middle East tensions

Gold remains on the back foot below $4,650 through the first half of the European session. However, the lack of follow-through selling warrants caution before positioning for an extension of the intraday retracement slide from the $4,700 neighborhood, or the highest level since May 14, touched earlier this Tuesday. The US Dollar is seen building on its recovery from a three-month low as inflation risks stemming from volatile energy prices keep bets for at least one interest rate hike by the US Federal Reserve on the table.

Bitcoin tops $80,000 as US Treasury fights high yields – AERO, VIRTUAL rally

Bitcoin extends gains above $80,000 as broader market risk-on sentiment persists. The scarce asset could extend its rally as the US Treasury combats high yields in the long-dated bond market, with further interventions on the horizon. Aerodrome Finance (AERO) and Virtuals Protocol (VIRTUAL) emerged as top performers over the last 24 hours.

The forex market is switching to a ‘debasement trade’
The US dollar has stabilised near three-month lows thanks to a rapid recovery in Treasury bond yields. Yields on 30-year bonds are returning to the levels seen following the Treasury’s announcement that it was increasing the minimum purchase volume to $4 billion. The greenback got support from falling stock indices, the continued rally in Brent crude, and positive signals from the US economy.
$20 billion offered, $2 billion taken: Why Treasury doubled its buyback cap

The US Treasury moved off its own calendar on Wednesday, and that is the part worth sitting with. At 12:32 GMT, the department said it would at least double the size of liquidity support buyback operations in the 10-year to 20-year and 20-year to 30-year sectors, lifting the maximum from $2 billion per operation to at least $4 billion, effective September 9 and running to November 4.