Reece Limited Elliott Wave technical forecast

ASX: REECE LIMITED – REH Elliott Elliott Wave Technical Analysis TradingLounge (1D Chart)
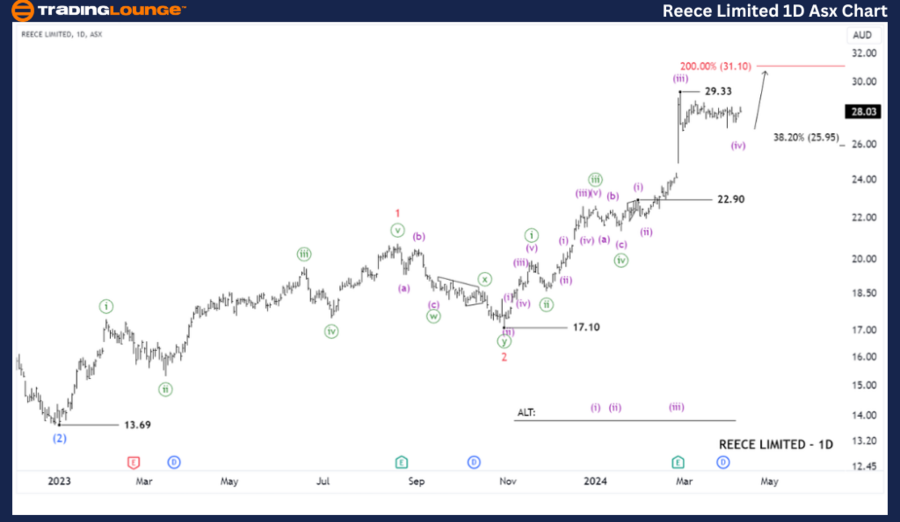
Greetings, Our Elliott Wave analysis today updates the Australian Stock Exchange (ASX) with REECE LIMITED - REH. We confirm that the price action is consolidating and extending horizontally, as well as converging, suggesting a Triangle pattern nearing completion. Therefore, following the Triangle, there will be a trading opportunity within the bull market.
ASX: REH Elliott Wave technical analysis
Function: Major trend (Minute degree, green).
Mode: Motive.
Structure: Impulse.
Position: Wave (iv)-purple of Wave ((v))-green.
Details: The short-term outlook indicates that wave (iv)-purple appears to have completed, and wave (v)-purple is ready to resume its upward movement at any moment. It is targeting a goal of 31.10, while maintaining a price above 25.95 is advantageous and provides significant support for this outlook.
Invalidation point: 22.90
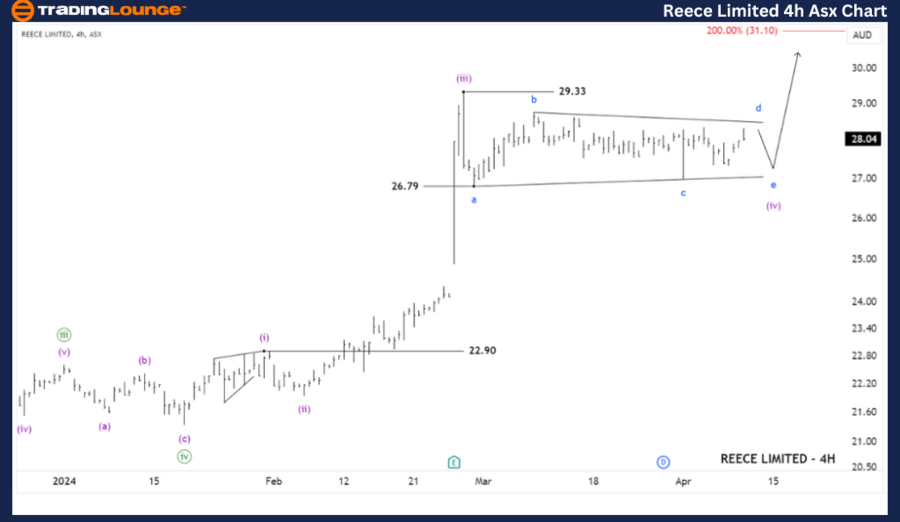
ASX: REH four-hour chart analysis
Function: Major trend (Minuette degree, purple).
Mode: Motive.
Structure: Impulse.
Position: Wave (iv)-purple.
Details: The shorter-term outlook further suggests that the (iv)-purple wave is unfolding as a Triangle pattern. The indication of a Triangle pattern comes from the price action consolidating horizontally and gradually narrowing. Therefore, this Triangle pattern seems to be nearing completion with the d-blue and e-blue waves, and after the Triangle is finished, the (v)-purple wave will likely push higher. As long as the price remains above the level of 26.79, if the price drops below this level, it would suggest that this Triangle pattern is invalidated.
Invalidation point: 26.79.
Conclusion
Our analysis, forecast of contextual trends, and short-term outlook for ASX: REECE LIMITED - REH aim to provide readers with insights into the current market trends and how to capitalize on them effectively. We offer specific price points that act as validation or invalidation signals for our wave count, enhancing the confidence in our perspective. By combining these factors, we strive to offer readers the most objective and professional perspective on market trends.
Author

Peter Mathers
TradingLounge
Peter Mathers started actively trading in 1982. He began his career at Hoei and Shoin, a Japanese futures trading company.


