|

Raytheon Technologies (RTX): The breakout toward $222

Raytheon Technologies Corp (NYSE: RTX) leads the aerospace and defense sector. Recent geopolitical events have fueled strong outperformance and momentum for the stock. Today, we analyze the Elliott Wave pattern driving its strategic breakout. Our examination provides a clear technical roadmap for its ascent. This convergence of sector strength and wave structure creates a compelling technical setup.

Elliott Wave Analysis

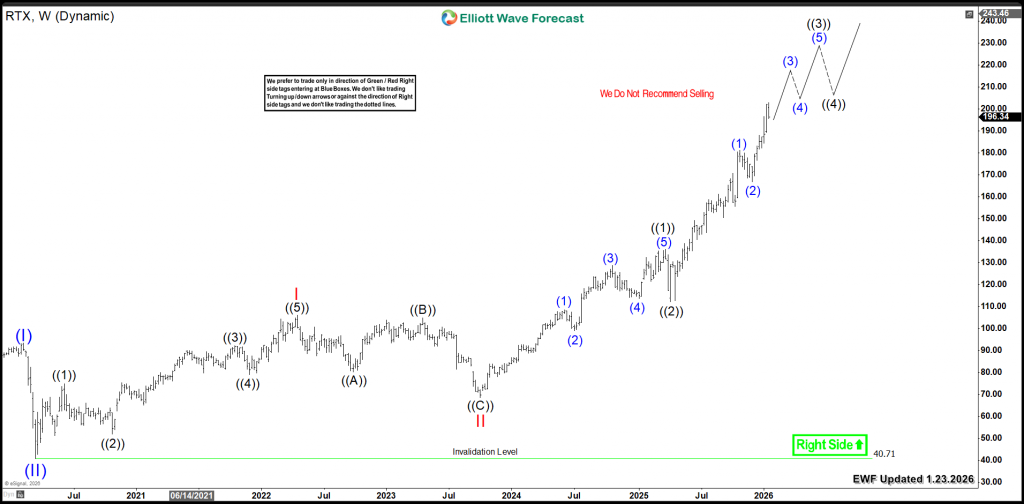
From its 2020 low, RTX created a three-wave advance to new highs. Wave I ended at $106, followed by Wave II at $68. Currently, Wave III remains in progress. This weekly cycle also shows three waves into new highs. Therefore, the stock has an incomplete bullish sequence. It aims to complete five-wave advances from both 2020 and 2023.

The projected path shows an extension toward $222. This move will likely occur within wave ((3)). Consequently, it can later propel Wave III beyond $250.

RTX should continue extending higher through a series of third and fourth waves. The key invalidation level is the April 2025 low of $112. All daily corrections must hold above this level. These pullbacks will create buying opportunities as 3, 7, or 11-swing patterns.

RTX Weekly Chart 1.23.2026

Conclusion

RTX’s bullish cycle confirms further upside ahead. Consequently, traders should target strategic entries during daily pullbacks. Apply our Elliott Wave methodology for exact timing. Specifically, enter the market after a 3, 7, or 11-swing correction completes. Additionally, our proprietary Blue Box system identifies high-probability reversal zones. This disciplined approach provides clarity and confidence. Ultimately, it positions you to capture the next major advance.

Author

Elliott Wave Forecast Team

Elliott Wave Forecast Team

ElliottWave-Forecast.com

More from Elliott Wave Forecast Team
Share:

Editor's Picks

EUR/USD struggles near 1.1850, with all eyes on US CPI data

EUR/USD holds losses while keeping its range near 1.1850 in European trading on Friday. A broadly cautious market environment paired with a steady US Dollar undermines the pair ahead of the critical US CPI data. Meanwhile, the Eurozone Q4 GDP second estimate has little to no impact on the Euro. 

GBP/USD recovers above 1.3600, awaits US CPI for fresh impetus

GBP/USD recovers some ground above 1.3600 in the European session on Friday, though it lacks bullish conviction. The US Dollar remains supported amid a softer risk tone and ahead of the US consumer inflation figures due later in the NA session on Friday. 

Gold remains below $5,000 as US inflation report looms

Gold retreats from the vicinity of the $5,000 psychological mark, though sticks to its modest intraday gains in the European session. Traders now look forward to the release of the US consumer inflation figures for more cues about the Fed policy path. The outlook will play a key role in influencing the near-term US Dollar price dynamics and provide some meaningful impetus to the non-yielding bullion.

US CPI data set to show modest inflation cooling as markets price in a more hawkish Fed

The US Bureau of Labor Statistics will publish January’s Consumer Price Index data on Friday, delayed by the brief and partial United States government shutdown. The report is expected to show that inflationary pressures eased modestly but also remained above the Federal Reserve’s 2% target.

A tale of two labour markets: Headline strength masks underlying weakness

Undoubtedly, yesterday’s delayed US January jobs report delivered a strong headline – one that surpassed most estimates. However, optimism quickly faded amid sobering benchmark revisions.

Solana Price Forecast: Mixed market sentiment caps recovery

Solana (SOL) is trading at $79 as of Friday, following a correction of over 9% so far this week. On-chain and derivatives data indicates mixed sentiment among traders, further limiting the chances of a price recovery.