|

The QQQ ETF's price has exhibited prolonged overbought conditions

The QQQ ETF's price has exhibited prolonged overbought conditions, as indicated by the Relative Strength Index (RSI), suggesting the potential for a pullback. On the daily chart, we observe two failed attempts by the price to surpass the 371 level, signifying a notable resistance zone.

The 371-374 supply zone on the daily chart holds crucial significance, as its breach would imply the continuation of the ongoing trend. 

Conversely, if the price fails to break through this zone, it could trigger a retracement towards crucial support levels at 366, 361, and 357. 

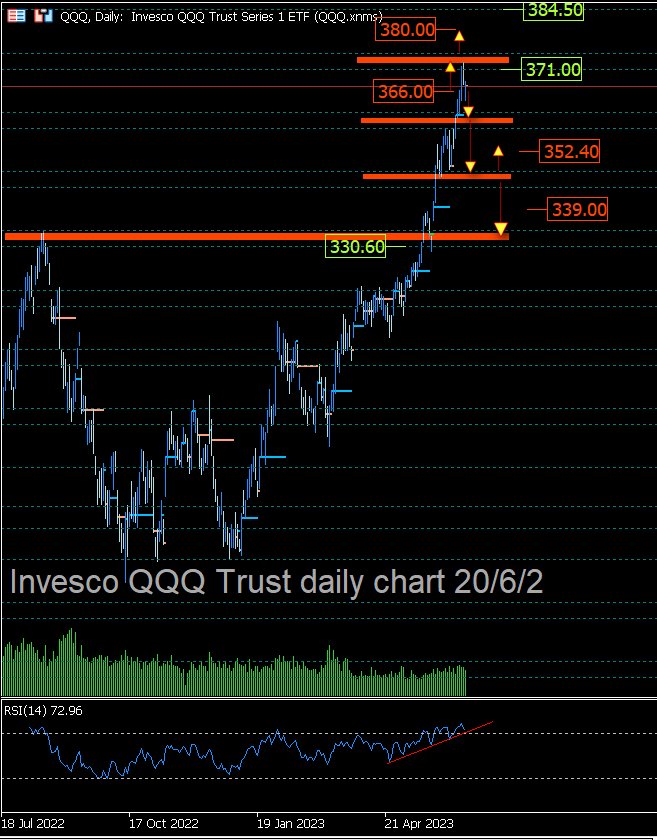
A decisive drop below 357 might signify the onset of a significant pullback, with the price potentially descending to around 330.

In the event of a breakout above the 371-374 zone, traders and investors should closely monitor resistance levels at 380 and 384. These levels can act as major barriers as it enters an extremely over-bought area in the RSI indicator, possibly leading to a significant pullback in the price. Traders and investors need to pay attention to these areas for any signs of a trend reversal or increased selling pressure.

Author

Denis Joeli Fatiaki

Denis Joeli Fatiaki

Independent Analyst

Denis Joeli Fatiaki possesses over a decade of extensive experience as a multi-asset trader and Market Strategist.

More from Denis Joeli Fatiaki
Share:

Markets move fast. We move first.

Orange Juice Newsletter brings you expert driven insights - not headlines. Every day on your inbox.

By subscribing you agree to our Terms and conditions.

Editor's Picks

EUR/USD falls to near 1.1700 due to safe-haven demand

EUR/USD extends its losses, trading around 1.1710 during the Asian hours on Monday. The pair loses ground as the US Dollar strengthens on safe-haven demand, driven by a renewed rise in geopolitical risks following the United States’ capture of Venezuelan President Nicolas Maduro.

GBP/USD trades with modest losses below mid-1.3400s as geopolitical tensions lift USD

The GBP/USD pair opens with a modest bearish gap at the start of a new week and trades just below mid-1.3400s during the Asian session, down 0.10% for the day. Spot prices, however, lack follow-through selling and manage to hold above last week's swing low amid mixed fundamental cues.

Gold jumps over 1.5% to near $4,400 on US-Venezuela tensions

Gold holds sizeable gains near $4,400 in the Asian trading hours on Monday. The traditional safe-haven metal capitalizes on escalating geopolitical risks after the United States' capture of Venezuelan President Nicolas Maduro. Traders will closely monitor developments surrounding the US seizure of Maduro and await the US ISM Manufacturing Purchasing Managers' Index data later on Monday. 

Powerful guide to ISM, building permits, NFP and Silver technicals

Next week is important for U.S. markets. We get key economic data that can move stocks, bonds, and the dollar. The main reports are ISM Manufacturing, ISM Services, Building Permits, and Non-Farm Payrolls. Traders will watch these closely.

Economic outlook 2026-2027 in advanced countries: Solidity test

After a year marked by global economic resilience and ending on a note of optimism, 2026 looks promising and could be a year of solid economic performance. In our baseline scenario, we expect most of the supportive factors at work in 2025 to continue to play a role in 2026.

Crypto market outlook for 2026

Year 2025 was volatile, as crypto often is.  Among positive catalysts were favourable regulatory changes in the U.S., rise of Digital Asset Treasuries (DAT), adoption of AI and tokenization of Real-World-Assets (RWA).