|

QQQ Elliott Wave: Forecasting the rally from the blue box

In this technical article, we are going to present Elliott Wave charts of QQQ ETF .  As our members know QQQ has recently bounce from the Equal Legs area.  The EWF has reached the extreme zone from the 540.6 peak and found buyers as expected.   In the following sections, we will explain the Elliott Wave forecast.

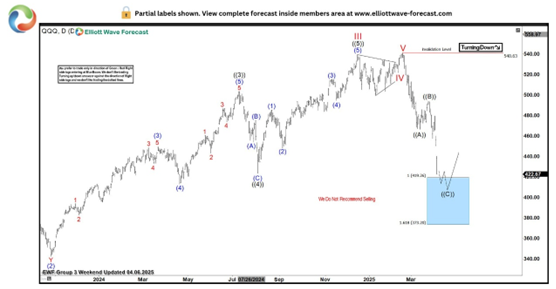
QQQ Elliott Wave one-hour chart 04.06.2025

The current view suggests QQQ is trading within the cycle from the 540.63 peak that is unfolding as a Elliott Wave Zig Zag pattern.  We expect an extension toward the extreme zone at 419.26-373.2 . At that zone buyers should re-enter, which could lead to a further rally in a 3 waves bounce at least. We recommend that members avoid selling QQQ .

Official trading strategy on How to trade 3, 7, or 11 swing and equal leg is explained in details in Educational Video, available for members viewing inside the membership area.

fxsoriginal

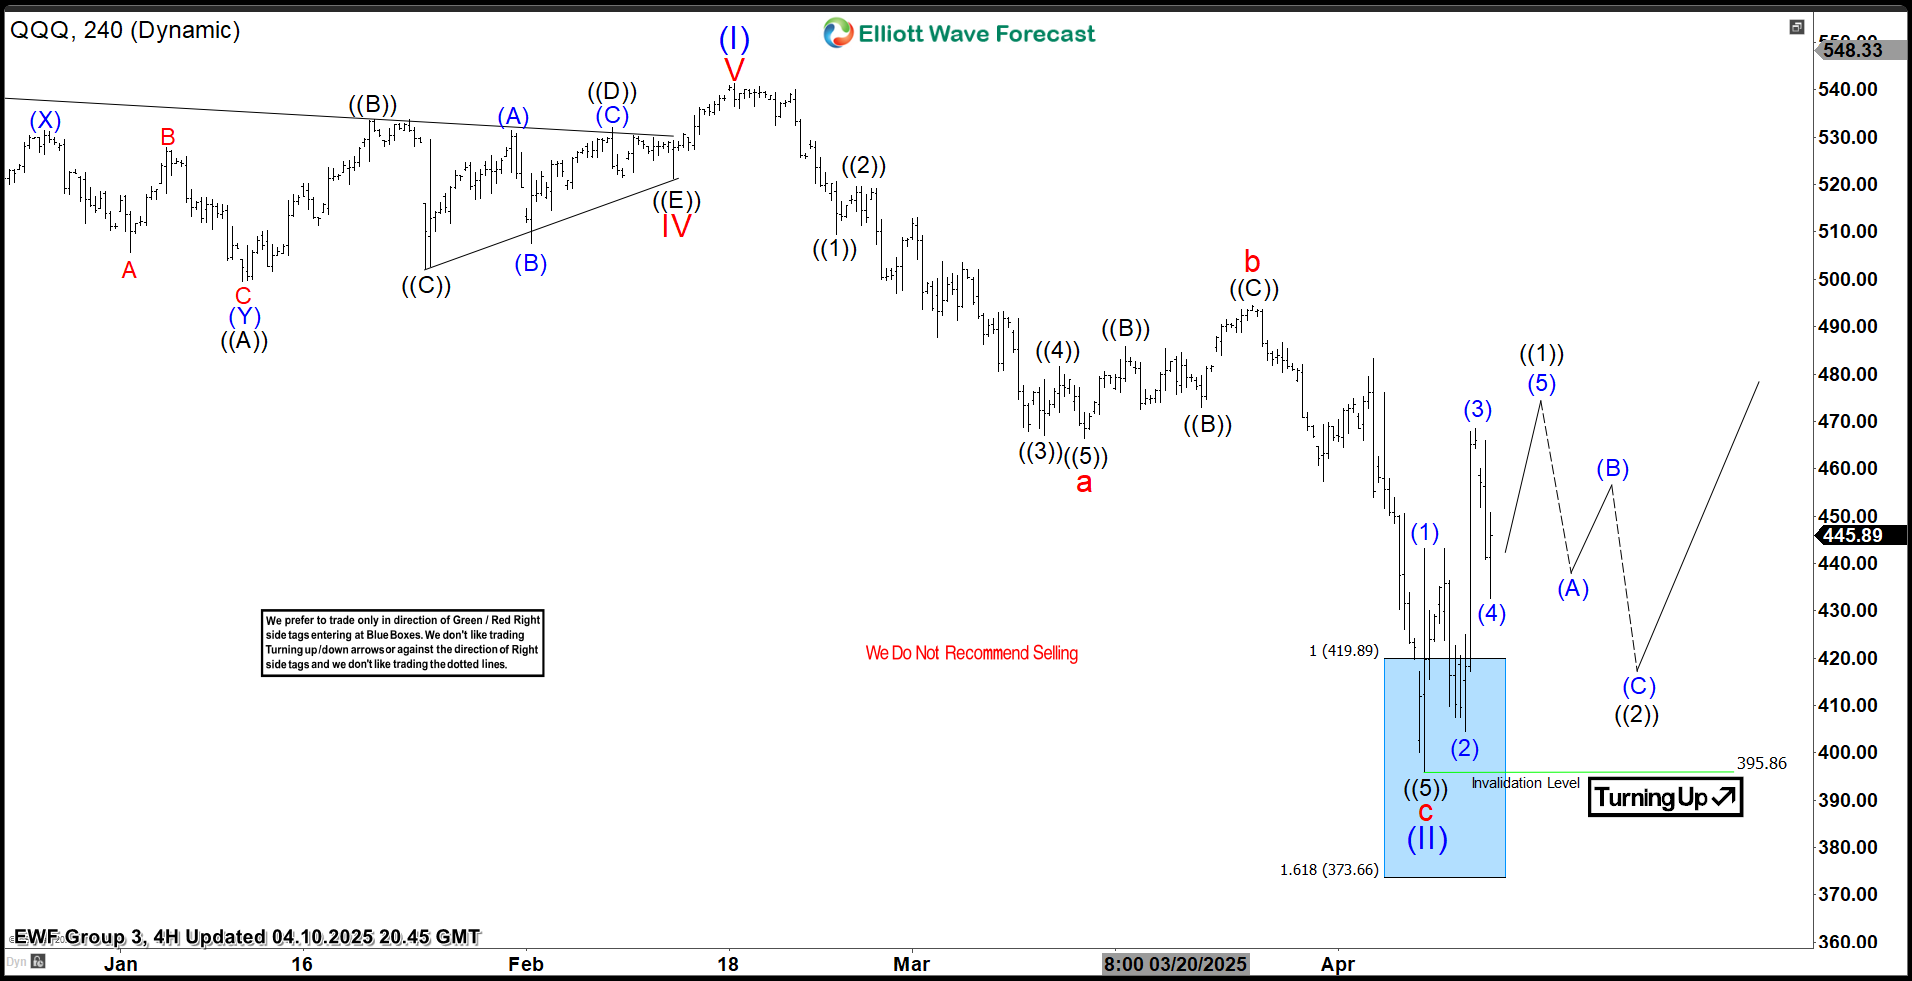
QQQ Elliott Wave one-hour chart 04.10.2025

The ETF made made extension down and reached Equal Legs area as expected. QQQ found buyers, and made decent reaction from the Blue Box zone.  Cycle from the peak ended at 395.86 low. As far as the mentioned pivot holds, we can see further strength in the ETF. As a result, members who took the long trades are enjoying profits in risk-free positions. The 395.86 level remains key for the current bullish outlook to stay valid.

QQQ

Author

Elliott Wave Forecast Team

Elliott Wave Forecast Team

ElliottWave-Forecast.com

More from Elliott Wave Forecast Team
Share:

Editor's Picks

EUR/USD deflates to fresh lows, targets 1.1600

The selling pressure on EUR/USD now gathers extra pace, prompting the pair to hit fresh multi-week lows in the 1.1625-1.1620 band on Friday. The continuation of the downward bias comes in response to further gains in the US Dollar as market participants continue to assess the mixed release of US Nonfarm Payrolls in December.

GBP/USD breaks below 1.3400, challenges the 200-day SMA

GBP/USD remains under heavy fire and retreats for the fourth consecutive day on Friday. Indeed, Cable suffers the strong performance of the Greenback, intensified post-mixed NFP, and trades at shouting distance from its critical 200-day SMA near 1.3380.

Gold flirts with yearly tops around $4,500

Gold keeps its positive bias on Friday, adding to Thursday’s advance and challenging yearly highs in the $4,500 region per troy ounce. The risk-off sentiment favours the yellow metal despite the firmer tone in the Greenback and rising US Treasury yields.

Crypto Today: Bitcoin, Ethereum, XRP risk further decline as market fear persists amid slowing demand

Bitcoin holds $90,000 but stays below the 50-day EMA as institutional demand wanes. Ethereum steadies above $3,000 but remains structurally weak due to ETF outflows. XRP ETFs resume inflows, but the price struggles to gain ground above key support.

Week ahead – US CPI might challenge the geopolitics-boosted Dollar

Geopolitics may try to steal the limelight from US data. A possible US Supreme Court ruling on tariffs could dictate market movements. A crammed data calendar next week, US CPI comes on Tuesday; Fedspeak to intensify.

XRP trades under pressure amid weak retail demand

XRP presses down on the 50-day EMA support as risk-averse sentiment spreads despite a positive start to 2026. XRP faces declining retail demand, as reflected in futures Open Interest, which has fallen to $4.15 billion.