|

QBTS Elliott Wave view: Buyers should wait for pullback

D-Wave Quantum Inc., (QBTS) develops & delivers quantum computing systems, software & services worldwide. It comes under Technology sector & trades as “QBTS” ticker at Nasdaq. It rises almost 41 times since November-2024 & can see more upside against August-2025 low.

Since inception in 2020, it made all time low of 0.40 on May-2023. After that it trade higher and consolidated since November-2024 breakout. Currently, it is trading in bullish sequence against 8.20.2025 low & may extend into $41.25 – $43.95 area before pullback. We like to buy the next correction in 3, 7 or 11 swings at extreme area against August low.

Since May-2023 low, it started bullish impulse rally & now trading in ((3)) of I. It placed (1) of ((1)) at $3.20 high, (2) at 0.57 low, (3) at $10.50 high, (4) at $5.60 low & (5) at $11.41 high on 12.27.2024. It ended ((2)) at $3.74 low on 1.13.2025 as more than 0.618 Fibonacci retracement. Above there, it placed (1) of ((3)) at $20.56 high, (2) at $14.20 low & rallying in (3). Within (1), it ended 1 at $11.95 high, 2 at $5.77 low, 3 at $19.77 high, 4 at $14.29 low & 5 at $20.56 high. It ended (2) pullback as double correction at $14.20 low on 8.20.2025.

QBTS – Elliott Wave latest daily view

Chart

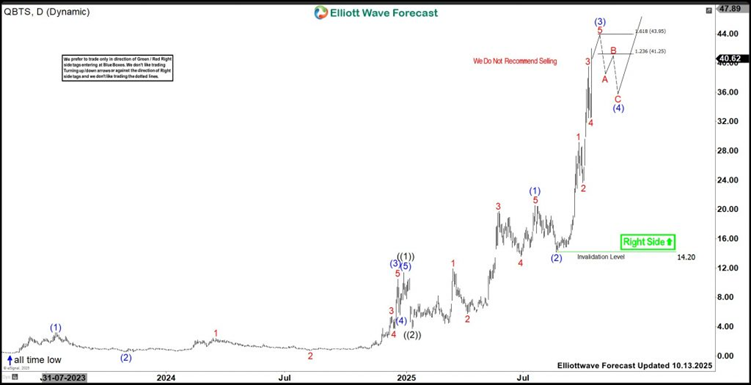
Above (2) low, it placed 1 of (3) at $29.18 low, 2 at $23.67 low, 3 at $39.55 high, 4 at $32.49 low & favors rally in 5 to finish (3). It expects rally to extend into $41.25 – $43.95 area to finish (3) before starts pullback in (4) against August low. But if breaks above $43.95, it can extend towards $46.87 – $47.93 area to finish (3) as long as high comes with momentum divergence. It already reached the minimum extreme area, so chasing longs at the moment is risky, but do not like selling. We like to buy the next pullback in 3, 7 or 11 swings in (4), correcting against August low. Generally, (4) can pullback between 0.236 – 0.382 Fib retracement of (3), which measured once (3) ends. 

Author

Elliott Wave Forecast Team

Elliott Wave Forecast Team

ElliottWave-Forecast.com

More from Elliott Wave Forecast Team
Share:

Markets move fast. We move first.

Orange Juice Newsletter brings you expert driven insights - not headlines. Every day on your inbox.

By subscribing you agree to our Terms and conditions.

Editor's Picks

EUR/USD steadies near 1.1750 ahead of final Eurozone CPI amid fading USD recovery

The EUR/USD pair steadies around the 1.1750 area during the Asian session on Wednesday, and for now, seems to have stalled the previous day's sharp retracement slide from the highest level since September 24. Meanwhile, the fundamental backdrop remains tilted in favor of bullish traders and suggests that the path of least resistance for spot prices remains to the upside.

GBP/USD gains ground above 1.3400 on UK PMI optimism

The GBP/USD pair gains momentum to around 1.3425 during the early Asian session on Wednesday. The Pound Sterling edges higher against the Greenback on the upbeat UK preliminary S&P Global Purchasing Managers' Index data. Traders will take more cues from the Fedspeak later on Wednesday. 

Gold advances to near seven-week highs amid US labor market cooling

Gold price extends its upside to near seven-week highs above $4,300 during the Asian trading hours on Wednesday. The precious metal gains momentum as the US labor market remains relatively resilient but shows signs of slowing. The mixed US employment report for November reinforces bets of further rate cuts by the US Federal Reserve and weighs on the US Dollar.

XRP dips as bearish pressure persists despite ETF growth

Ripple is finding footing above $1.90 at the time of writing on Tuesday after a bearish wave swept across the broader cryptocurrency market, building on persistent negative sentiment.

Ukraine-Russia in the spotlight once again

Since the start of the week, gold’s price has moved lower, but has yet to erase the gains made last week. In today’s report we intend to focus on the newest round of peace talks between Russia and Ukraine, whilst noting the release of the US Employment data later on day and end our report with an update in regards to the tensions brewing in Venezuela.

BNB Price Forecast: BNB slips below $855 as bearish on-chain signals and momentum indicators turn negative

BNB, formerly known as Binance Coin, continues to trade down around $855 at the time of writing on Tuesday, after a slight decline the previous day. Bearish sentiment further strengthens as BNB’s on-chain and derivatives data show rising retail activity.