PYPL Elliott Wave technical analysis [Video]
![PYPL Elliott Wave technical analysis [Video]](https://editorial.fxstreet.com/images/Markets/Equities/SP500/wall-street-sign-637299022550250958.jpg)
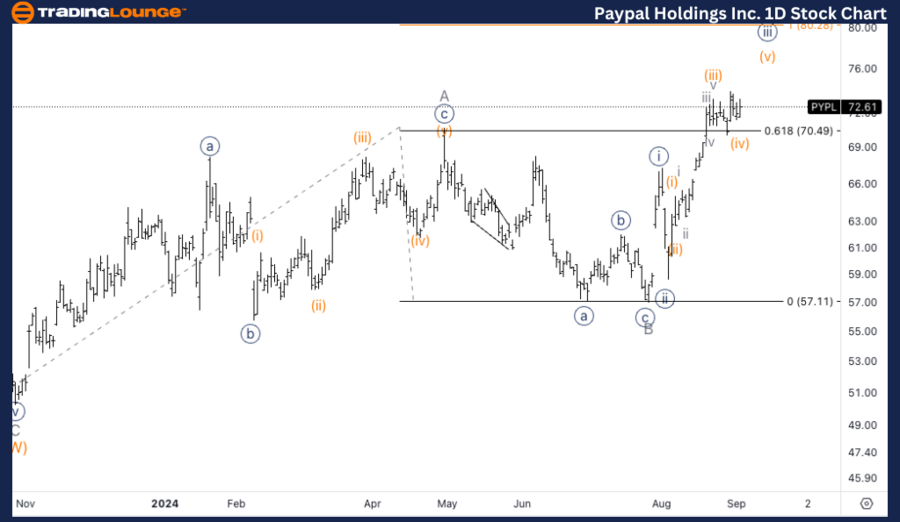
PYPL Elliott Wave Analysis Trading Lounge Daily Chart,
Paypal Holdings Inc., (PYPL Daily Chart.
PYPL Elliott Wave technical analysis
Function: Trend.
Mode: Impulsive.
Structure: Motive.
Position: Wave 3 or C.
Direction: Upside in wave 3/C.
Details: We are looking at upside potential within wave 3 or C which needs to unfold in a five wave manner, and we seem to be standing within wave {iii}. Equality of 3 vs. 1 stands Trading Level 8 at 80$, which is often time a minimum upside target for wave 3 or C.
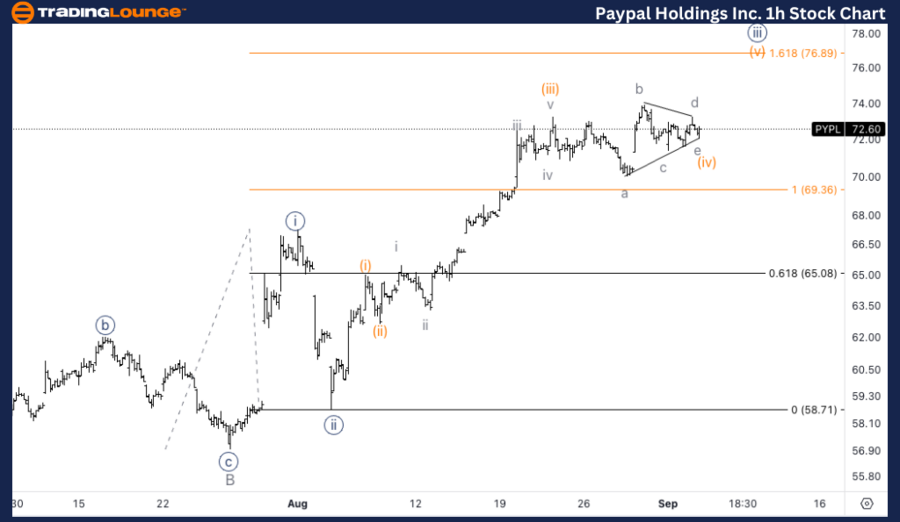
PYPL Elliott Wave Analysis Trading Lounge 1H Chart,
Paypal Holdings Inc., (PYPL) 1H Chart.
PYPL Elliott Wave technical analysis
Function: Trend.
Mode: Impulsive.
Structure: Motive.
Position: Wave (iv) of {iii}.
Direction: Upside in wave {iii}.
Details: Looking for a triangle in wave (iv) to be near completion to then continue higher towards 1.618 {iii} vs. {i}.
This analysis provides insight into PayPal Holdings Inc. (PYPL) based on the Elliott Wave Theory, focusing on both the daily and 1-hour charts to evaluate the current market structure and potential future movements.
PYPL Elliott Wave Technical Analysis – Daily chart
PYPL is currently unfolding in wave 3 or C, which is an impulsive wave characterized by strong upside potential. The equality level between wave 3 and wave 1 stands around Trading Level 8 at 80$, which often serves as a minimum target for wave 3 or C. Given this, we expect further upside as wave {iii} continues to develop, and reaching the 80$ target seems reasonable in the near term.
PYPL Elliott Wave technical analysis – One-hour chart
PYPL is in wave (iv) of {iii}, where a triangle correction seems to be forming. Once this triangle correction is completed, the stock is expected to resume its upside momentum toward the 1.618 Fibonacci extension of wave {iii} compared to wave {i}. This next leg up in wave (v) of {iii} could push the price toward the anticipated target of around 80$.
Technical analyst: Alessio Barretta.
PYPL Elliott Wave technical analysis [Video]
Author

Peter Mathers
TradingLounge
Peter Mathers started actively trading in 1982. He began his career at Hoei and Shoin, a Japanese futures trading company.


