|

Caterpillar ($CAT) showing 5 wave advance – What’s next?

In today’s article, we will look at the past performance of Caterpillar Inc. ($CAT). In our last article we explained that the stock has made new all time highs and will be pulling back soon in 3 or 7 swings to correct the cycle from Sep 2022 lows. This is how we saw it back in Jan 2023.

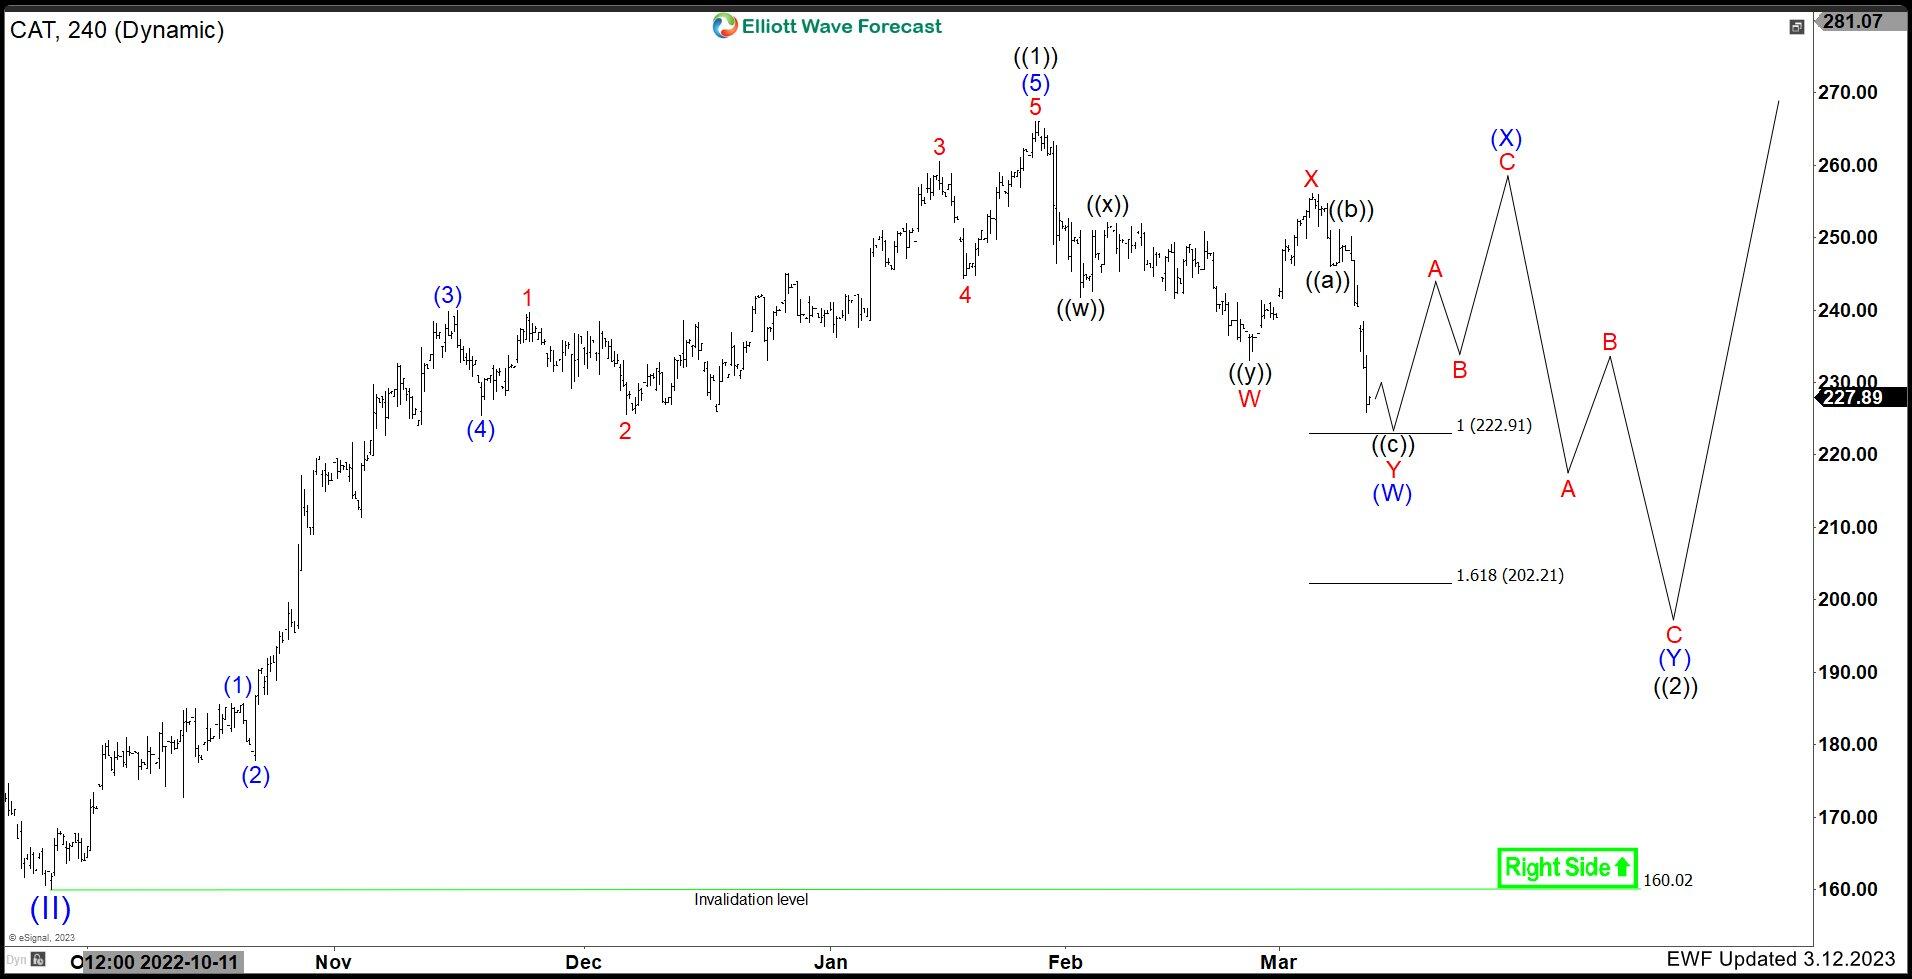
$CAT Elliott Wave latest view (4H)
Chart

In the 4H chart above, we can see that the stock advanced in a 5 wave impulse from Sep 2022 lows. The cycle ended on 1.27.2023 at $266.04 and a pullback is taking place as expected. So far, the pullback is showing 3 waves and is getting close to the equal legs area at $222.91 – 202.21 where buyers should appear for a bounce. Looking at the rest of the market and using Market Correlation, we expect that the bounce should fail and continue lower in 7 swings as shown in the chart above. Traders can attempt to buy the equal legs area in 3 swings and get risk free once the reaction takes place. We have a bullish sequence against September 2022 lows. So as long as price remains above $160.02, $CAT is expected to remain supported in 3, 7 or 11 swings.

Author

Elliott Wave Forecast Team

Elliott Wave Forecast Team

ElliottWave-Forecast.com

More from Elliott Wave Forecast Team
Share:

Editor's Picks

AUD/USD hits nine-week lows below 0.7000 on RBA Bullock's remarks

AUD/USD reverses a brief uptick and turns lower to hit nine-week lows below 0.7000 in the European morning on Tuesday, as traders digest cautious remarks from Reserve Bank of Australia (RBA) Governor Michele Bullock during the press conference. Earlier on, the RBA raised the cash rate to 4.60%, as widely expected, leaving the door open to further rate hikes if needed.

USD/JPY consolidates near 157.50 as a bullish USD counters intervention risks

USD/JPY struggles to capitalize on the overnight bounce from a one-week low, consolidating around 157.50 in the Asian session on Tuesday. Trump's concerns about the Japanese Yen's weakness fueled speculation about another US-Japan joint intervention. This, along with the hawkish BoJ, underpins the JPY and caps the currency pair. Meanwhile, rising Fed rate-hike bets and oil-driven inflation fears continue to push US bond yields to multi-year highs, keeping the US Dollar pinned near a two-month high and supporting the pair.

Gold: Bulls seem hesitant as Fed hike bets, higher bond yields, and bullish USD cap upside

Gold clings to modest recovery gains through the first half of the European session, albeit it lacks follow-through and remains below $4,150. Moreover, the bearish fundamental backdrop keeps the precious metal within striking distance of the lowest level since August 4, around the $4,100 neighborhood touched on Monday, and warrants caution before positioning for any meaningful appreciation.

Chainlink trims gains after CCIP 2.0 launch, Swift ledger integration

Chainlink (LINK) edges below $15.00 on Tuesday, trimming its 10% gains from the previous day, driven by the launch of its new Cross-Chain Interoperability Protocol 2.0 and Swift ledger integration for tokenized deposits and 24/7 cross-border payments.

Focus turns to US job openings
In the euro area, focus turns to the September flash inflation print for Spain which will give the first indication of where the euro area data on Friday lands. We expect a modest rise in headline due to higher energy costs and a small increase in core inflation. We also receive the European Commission's business survey for September.
Fed vs BoJ: Both hiked. The market only believes one of them – and the chart shows which

The Fed and the BoJ have just done something remarkably similar. Both central banks raised interest rates by 25 bps last week, both are confronting inflation risks, and both signal that future decisions will depend on incoming economic data.
















