|

Palladium Price Analysis: XPD/USD renews weekly top around $2,650, rising channel eyed

  • Palladium prints four-day uptrend inside a nine-week-old ascending trend channel.
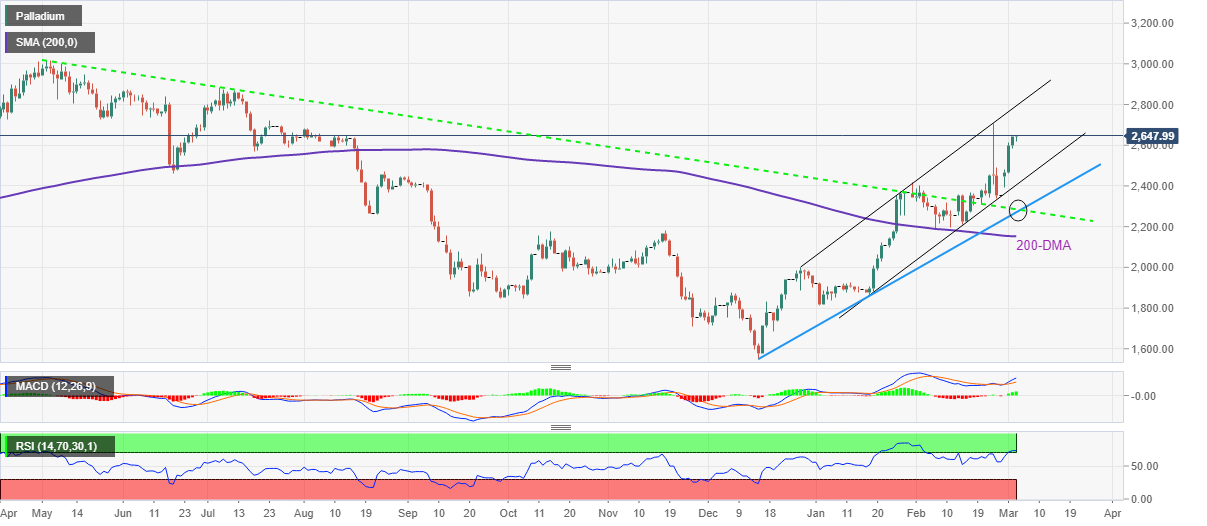
  • Overbought RSI tests buyers but upside momentum remains intact beyond $2,280-70.

Palladium (XPD/USD) remains on the front foot around $2,647, up 0.25% intraday during the four-day winning streak ahead of Thursday’s European session.

The precious metal not only renews weekly top but also stays near to the highest levels marked since late July, pinned the previous week.

The upside momentum justifies bullish MACD signals inside an upward sloping trend channel from late December 2021. However, the overbought RSI line hints at a pullback.

That said, June 2021 low near $2,460 may lure the short-term sellers but the support line of the stated channel, around $2,400, will challenge the quote’s further downside,

Even if the quote drops below $2,400, a convergence of the previous resistance line from early 2021 and an 11-week-old rising support line, near $2,280-70 will be a tough nut to crack for the palladium bulls afterward.

Meanwhile, the XPD/USD’s further upside will aim for the stated channel’s resistance line, near $2,800 at the latest, before challenging the July 2021 peak of 2,882.

Palladium: Daily chart

Trend: Bullish

Additional important levels

Overview
Today last price2647.19
Today Daily Change5.83
Today Daily Change %0.22%
Today daily open2641.36
 
Trends
Daily SMA202362.29
Daily SMA502201.24
Daily SMA1002042.84
Daily SMA2002152.95
 
Levels
Previous Daily High2644.05
Previous Daily Low2585.65
Previous Weekly High2706.5
Previous Weekly Low2313.91
Previous Monthly High2706.5
Previous Monthly Low2193.25
Daily Fibonacci 38.2%2621.74
Daily Fibonacci 61.8%2607.96
Daily Pivot Point S12603.32
Daily Pivot Point S22565.29
Daily Pivot Point S32544.92
Daily Pivot Point R12661.72
Daily Pivot Point R22682.09
Daily Pivot Point R32720.12

Author

Anil Panchal

Anil Panchal

FXStreet

Anil Panchal has nearly 15 years of experience in tracking financial markets. With a keen interest in macroeconomics, Anil aptly tracks global news/updates and stays well-informed about the global financial moves and their implications.

More from Anil Panchal
Share:

Editor's Picks

AUD/USD eyes 0.7150 barrier nine-day EMA

AUD/USD inches higher after registering modest losses in the previous day, trading around 0.7130 during the Asian hours. The technical analysis of the daily chart indicates that the pair is moving sideways within the rectangle pattern, suggesting a consolidation as neither the bulls nor the bears have enough momentum to take control of the market.

USD/JPY trades below 160.00 intervention threshold; bullish bias intact

The USD/JPY pair attracts some sellers during the Asian session amid fears that authorities will step in again to prop up the Japanese Yen. Furthermore, the Israel-Lebanon truce prompts some profit-taking around the US Dollar and exerts downward pressure on the currency pair.

Gold rebounds from one-week low as Israel-Lebanon truce pressures safe-haven USD

Gold gains some positive traction on Thursday and climbs to the $4,475 area during the Asian session, reversing a major part of the previous day's slide to a one-week low. The Israel-Lebanon truce prompts some profit-taking around the US Dollar and supports the commodity. 


Hyperliquid: ETF demand, capital rotation fuel HYPE rally as Bitcoin melts

Hyperliquid price sustains an upward trend near its all-time high of $75.76 on Thursday after posting 80% gains in May, while Bitcoin (BTC) retraces below $65,000, triggering a market-wide panic.

Kevin Warsh takes the Fed helm: What it means for the US Dollar
The Federal Reserve moves away from the highly predictable "forward guidance" model of the Jerome Powell era to a new “Kevin Warsh environment”, characterized by less communication, more policy surprises, and an increased focus on the Fed's complex balance sheet.
Recession on paper: What really moves the Canadian Loonie now?

Statistics Canada handed the headline writers a gift and the analysts a headache. Real GDP shrank 0.1% on an annualized basis in the first quarter, and with the fourth quarter of 2025 revised down to a 1.0% contraction, that is two negative quarters in a row, the textbook definition of a technical recession and Canada's first since the pandemic.