|

Palladium Price Analysis: XPD/USD grinds higher above $2,600 inside weekly rising wedge

  • Palladium stays firmer around weekly top, extends bounce off three-month low.
  • Bearish chart formation, sustained trading below 200-SMA probe buyers.
  • Late May’s bottom add to the upside filters, sellers will have a bumpy road below $2,460.

Palladium (XPD/USD) picks up bids around $2,620, up 0.21% intraday, as European traders brace for Thursday’s bell.

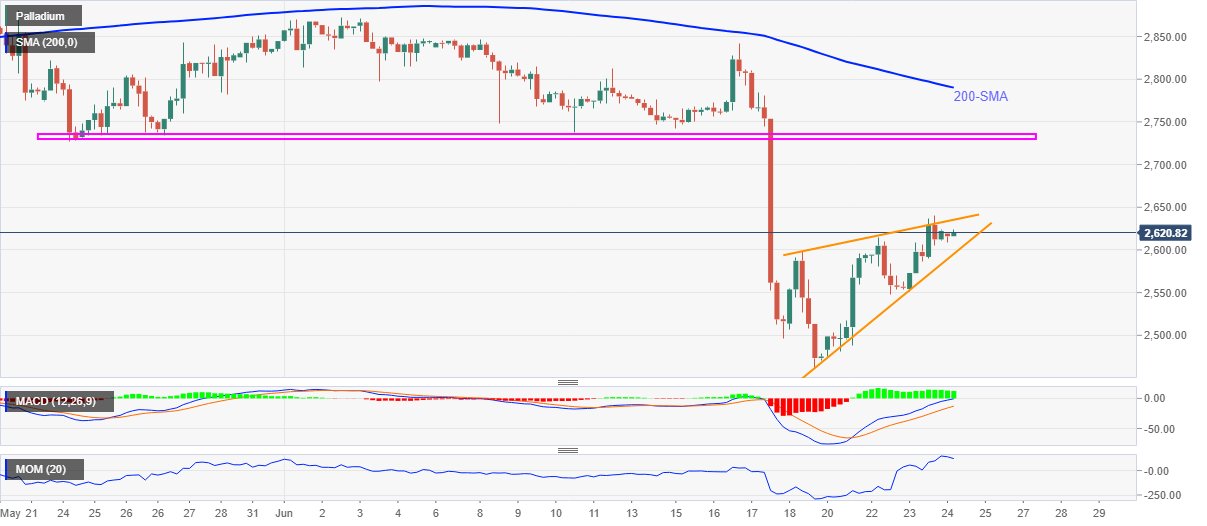
The precious metal consolidates the previous week’s heavy losses following a bounce off a four-month low, portrayed the last Friday. In doing so, palladium prices print a bearish chart pattern, rising wedge, on the four-hour (4H) play.

Not only the bearish formation but receding strength of the bullish MACD and challenges to further upside raised by the Momentum line also need palladium buyers to remain cautious. Furthermore, the commodity’s sustained trading below 200-SMA becomes an extra reason for sellers to remain hopeful.

Hence, a clear downside break of $2,595 will be a trigger to the quote’s south-run challenging the monthly bottom surrounding $2,460. During the fall, Tuesday’s swing low near $2,550, followed by the $2,500 threshold, will test the Palladium bears.

Meanwhile, the bright metal’s run-up beyond $2,636 will defy the bearish chart pattern by directing the bulls toward a monthly horizontal hurdle near $2,730-35, with the $2,700 round figure likely acting as an intermediate halt.

It’s worth noting that palladium buyers won’t be in full control until successfully crossing the 200-SMA level of $2,790, also the $2,800 psychological magnet to be on a safer side.

Palladium: Four-hour chart

Trend: Pullback expected

Additional important levels

Overview
Today last price2620.33
Today Daily Change5.80
Today Daily Change %0.22%
Today daily open2614.53
 
Trends
Daily SMA202747.01
Daily SMA502824.39
Daily SMA1002652.4
Daily SMA2002499.05
 
Levels
Previous Daily High2639.83
Previous Daily Low2551.5
Previous Weekly High2841.3
Previous Weekly Low2461.72
Previous Monthly High3018.8
Previous Monthly Low2726.52
Daily Fibonacci 38.2%2606.09
Daily Fibonacci 61.8%2585.24
Daily Pivot Point S12564.08
Daily Pivot Point S22513.62
Daily Pivot Point S32475.75
Daily Pivot Point R12652.41
Daily Pivot Point R22690.28
Daily Pivot Point R32740.74

Author

Anil Panchal

Anil Panchal

FXStreet

Anil Panchal has nearly 15 years of experience in tracking financial markets. With a keen interest in macroeconomics, Anil aptly tracks global news/updates and stays well-informed about the global financial moves and their implications.

More from Anil Panchal
Share:

Editor's Picks

EUR/USD hovers above 1.1800 as USD stabilizes

EUR/USD treads water above 1.1800 in the European session on Thursday. The US Dollar stabilizes, following the recent decline fuelled by concerns about the economic fallout from US President Trump's erratic trade policies, capping the pair's upside. All eyes now remain on Lagarde's speech and US-Iran nuclear talks. 

GBP/USD extends recovery to near 20-day EMA as US Dollar weakens

The Pound Sterling holds onto weekly gains around 1.3565 against the US Dollar during the Asian trading session on Thursday. The GBP/USD pair trades firmly as the US Dollar remains under pressure due to uncertainty surrounding the United States trade policy outlook.

Gold clings to gains amid sustained safe-haven flows ahead of US-Iran talks

Gold sticks to its modest intraday gains through the first half of the European session on Thursday, with bulls still awaiting a sustained move and acceptance above the $5,200 mark before placing fresh bets. 

Stellar: Relief bounce fades as bearish undertone persists

Stellar is trading around $0.16 at the time of writing on Thursday after rebounding more than 8% in the previous day. Derivatives data paints a negative picture as XLM’s short bets hit a monthly high while Open Interest continues to decline.

Nvidia delivers another monster earnings report, and forecasts big things to come

It was another monster earnings report from Nvidia for fiscal Q4. Revenues were $68.1bn, smashing estimates of $65bn. Gross profit margin was a healthy 75%, up from 73.5% in the prior quarter, and the outlook for this quarter was monstrous.

Solana strikes key resistance with double-digit gains

Solana trades at $88 at press time on Thursday, after an 11% upswing the previous day within a broader consolidation range of roughly three weeks. Institutional demand for Solana heightens as US spot SOL Exchange Traded Funds record $30 million of inflow on Wednesday.