Palladium Price Analysis: 61.8% Fibo. tests XPD/USD bulls inside monthly triangle
- Palladium prices struggle to extend three-day recovery from 200-DMA.
- Sluggish RSI portrays traders’ indecision inside a trend continuation pattern.
Having reversed from a monthly low during the early week, palladium (XPD/USD) prices remain sidelined at around $2,230 ahead of Friday’s European session.
In doing so, the precious metal holds onto the recovery moves from the 200-DMA but stays inside a symmetrical triangle formation established on March 18.
On an immediate basis, the 61.8% Fibonacci retracement (Fibo.) of December 2021 to March 2022 upside, near $2,260, restricts the quote further upside.
Following that, the upper line of the aforementioned triangle will join the 50% Fibo. to highlight the $2,475 as a tough nut to crack for the XPD/USD bulls.
Meanwhile, pullback moves may retest the 200-DMA level surrounding $2,133, a break of which will direct the palladium bears towards breaking the triangle’s support line, at $2,090 by the press time.
Also acting as the downside filter are the bottoms marked so far in April and March, respectively around $2,080 and $2,045.
Palladium: Daily chart
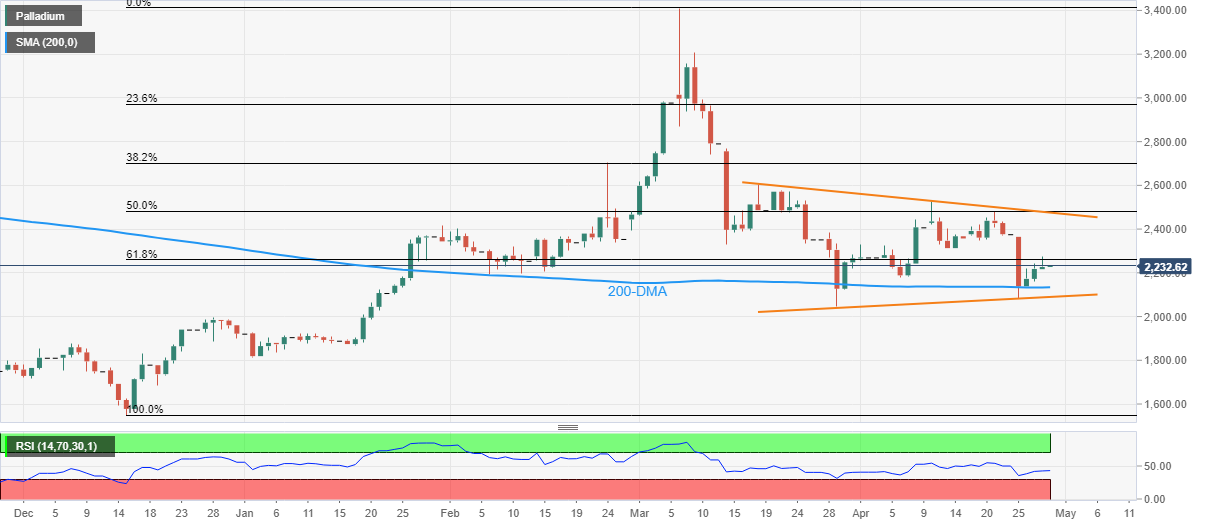
Trend: Sideways
Author

Anil Panchal
FXStreet
Anil Panchal has nearly 15 years of experience in tracking financial markets. With a keen interest in macroeconomics, Anil aptly tracks global news/updates and stays well-informed about the global financial moves and their implications.


