Palantir Stock Forecast: PLTR closes lower on Friday, -6.5% for the week
- Palantir stock has turned negative on the technical chart.
- The 9-day SMA has crossed below its 21-day counterpart.
- Lower inflation seen in the Core PCE print for September makes another Fed rate hike less likely.
- An AI study called Palantir a top performer among vendors.

Palantir (PLTR) stock closed at $15.07 on Friday, down 1.44% for the session and 6.52% for the week. Technical moving averages turned south late in the week as PLTR clocked in three down sessions in a row.
The US Personal Consumption Expenditures (PCE) data for September arrived before the opening bell, and core PCE inflation printed exactly in line with expectations. Core PCE grew 3.7% from a year ago and 0.3% from August. This information has sent the NASDAQ Composite higher as it reduces the chance of further rate hikes from the Federal Reserve.
The NASDAQ Composite held onto a gain for the session, up 0.38%, on Intel (INTC) and Amazon (AMZN) earnings, while the S&P 500 and Dow Jones lost 0.48% and 1.12% on Friday due to quarterly results from Chevron (CVX).
Palantir stock news
On Thursday, Dresner Advisory Services recognized Palantir as a “top performer” in the artificial intelligence and data science category.
Dresner’s 2023 AI, Data Science, and Machine Learning Wisdom of Crowds Market Study interviewed practitioners in the industry to find out which companies are most respected. Palantir bested other vendors in the analytical features & functions, model operations, and usability categories.
"Palantir's Artificial Intelligence Platform (AIP) enables organizations to bring the power of Generative AI into their most critical operations," said Akshay Krishnaswamy, Palantir's Chief Architect.
Dresner’s study further discovered that only 29% of organizations have adopted the use of generative AI, and for the most part they have only used it for non-production uses like corporate experiments.
Palantir is scheduled to deliver third-quarter earnings on November 2 next week. Wall Street analysts are forecasting $0.06 in adjusted earnings per share (EPS) on revenue of $556.37 million.
S&P 500 FAQs
What is the S&P 500?
The S&P 500 is a widely followed stock price index which measures the performance of 500 publicly owned companies, and is seen as a broad measure of the US stock market. Each company’s influence on the computation of the index is weighted based on market capitalization. This is calculated by multiplying the number of publicly traded shares of the company by the share price. The S&P 500 index has achieved impressive returns – $1.00 invested in 1970 would have yielded a return of almost $192.00 in 2022. The average annual return since its inception in 1957 has been 11.9%.
How are companies chosen to be included in the S&P 500?
Companies are selected by committee, unlike some other indexes where they are included based on set rules. Still, they must meet certain eligibility criteria, the most important of which is market capitalization, which must be greater than or equal to $12.7 billion. Other criteria include liquidity, domicile, public float, sector, financial viability, length of time publicly traded, and representation of the industries in the economy of the United States. The nine largest companies in the index account for 27.8% of the market capitalization of the index.
How can I trade the S&P 500?
There are a number of ways to trade the S&P 500. Most retail brokers and spread betting platforms allow traders to use Contracts for Difference (CFD) to place bets on the direction of the price. In addition, that can buy into Index, Mutual and Exchange Traded Funds (ETF) that track the price of the S&P 500. The most liquid of the ETFs is State Street Corporation’s SPY. The Chicago Mercantile Exchange (CME) offers futures contracts in the index and the Chicago Board of Options (CMOE) offers options as well as ETFs, inverse ETFs and leveraged ETFs.
What factors drive the S&P 500?
Many different factors drive the S&P 500 but mainly it is the aggregate performance of the component companies revealed in their quarterly and annual company earnings reports. US and global macroeconomic data also contributes as it impacts on investor sentiment, which if positive drives gains. The level of interest rates, set by the Federal Reserve (Fed), also influences the S&P 500 as it affects the cost of credit, on which many corporations are heavily reliant. Therefore, inflation can be a major driver as well as other metrics which impact the Fed decisions.
Palantir stock forecast
Palantir stock saw its 9-day Simple Moving Average (SMA) fall one penny below the 21-day SMA on Thursday. That divergence has moved lower on Friday.
The relationship between these two SMAs signals when downtrends are likely to continue. Likewise, when the 9-day SMA overtakes the 21-day SMA, the Palantir stock price usually rallies.
If PLTR price does move lower, the $13.50 to $14 support band may fortify the price action. This region has held up during downtrends in June, August and September. If not, the $11.62 resistance high from August 2022 might be Palantir’s only savior.
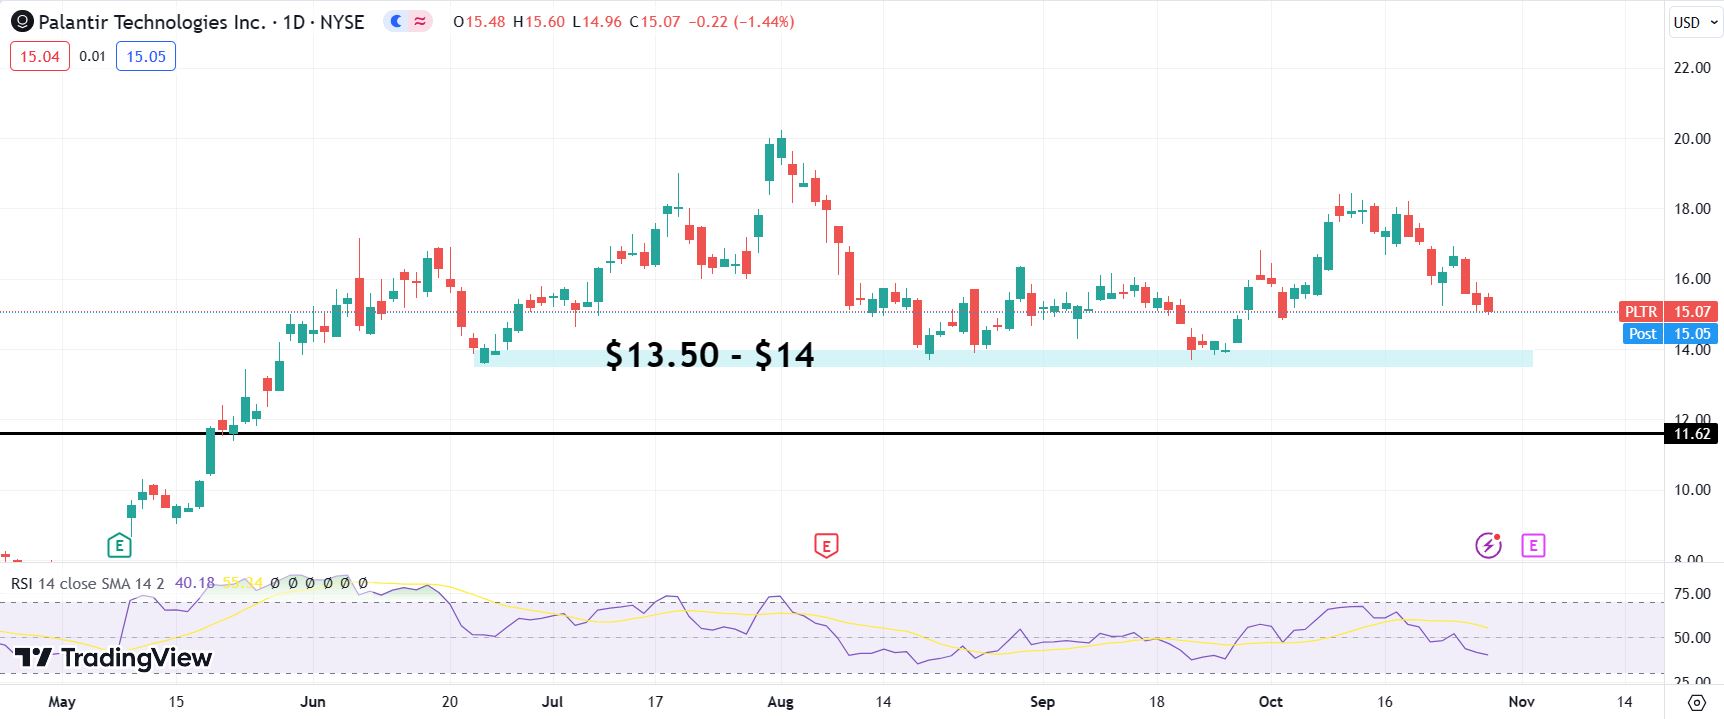
PLTR daily chart
Author

Clay Webster
FXStreet
Clay Webster grew up in the US outside Buffalo, New York and Lancaster, Pennsylvania. He began investing after college following the 2008 financial crisis.


