Overstock.com Earnings: OSTK stock jumps 25% on EPS beat
- OSTK reported EPS of $0.68 compared with estimates for $0.36.
- Overstock.com investment tZero received a strategic investment from Intercontinental Exchange.
- Net revenue was down 9% YoY and under consensus.

Overstock.com (OSTK) has jumped more than 25% to $45.70 in Wednesday's premarket after reporting a resounding beat on earnings per share (EPS). Wall Street had expected EPS of $0.36, but OSTK reported $0.68 – nearly double.
Overstock.com Stock News: Beat on EPS, bad on revenue
The ecommerce site that primarily sells furniture, home goods and clothing reported $613 million in revenue for the quarter, well short of the $644 million average estimate from analysts. This figure was also 9% off the same quarter one year ago.
The market seems to have disregarded this whiff and instead focused on clearing house InterContinental Exchange's investment in tZero. The latter is a blockchain platform focused on trading digital securities of which Overstock.com owns 80%. OSTK's myriad investments in blockchain technology have made it a popular retail stock for those trying to gain exposure to the cryptocurrency space.
"The foundational operational improvements we have made over the past two years have stabilized the business and positioned us well to navigate through economic and industry-specific cycles over the long term," said CEO Jonathan Johnson. "We are proving we can adjust to, execute through, and take advantage of both positive and negative jolts in the market."
OSTK key statistics
| Market Cap | $1.6 billion |
| Price/Earnings | 16 |
| Price/Sales | 0.6 |
| Price/Book | 2.4 |
| Enterprise Value | $1.3 billion |
| Operating Margin | 3% |
| Profit Margin |
13% |
| 52-week high | $111.28 |
| 52-week low | $35.67 |
| Short Interest | 16% |
| Average Wall Street Rating and Price Target | Buy, $108 |
Overstock.com Stock Forecast: Reversal is underway
While OSTK shares are rebounding marvelously on the earnings call, shares have been down more than 38% year to date. This means that a one-day rebound is not saying much. On the daily chart OSTK needs to retake $48.50 and $54.34 to make this bull run a long-term phenomenon. $48.50 is support from late 2020 that may turn into resistance. $54.34 is the recent high from February 9. The 50-day and 20-day moving averages are both near these resistance levels and add to their significance.
One piece of evidence that this may be a true reversal is that there is a price divergence with the Relative Strength Index (RSI). Between January 21 and February 22, a one-month period, the RSI drifted up from 17 to 31. This is an oversold reading to be sure, but the upward trajectory of the reading diverges with OSTK's price over that same period. The OSTK price dropped over that period from $40.86 to $36.45. RSI divergence often signal long-term reversals in share price are imminent.
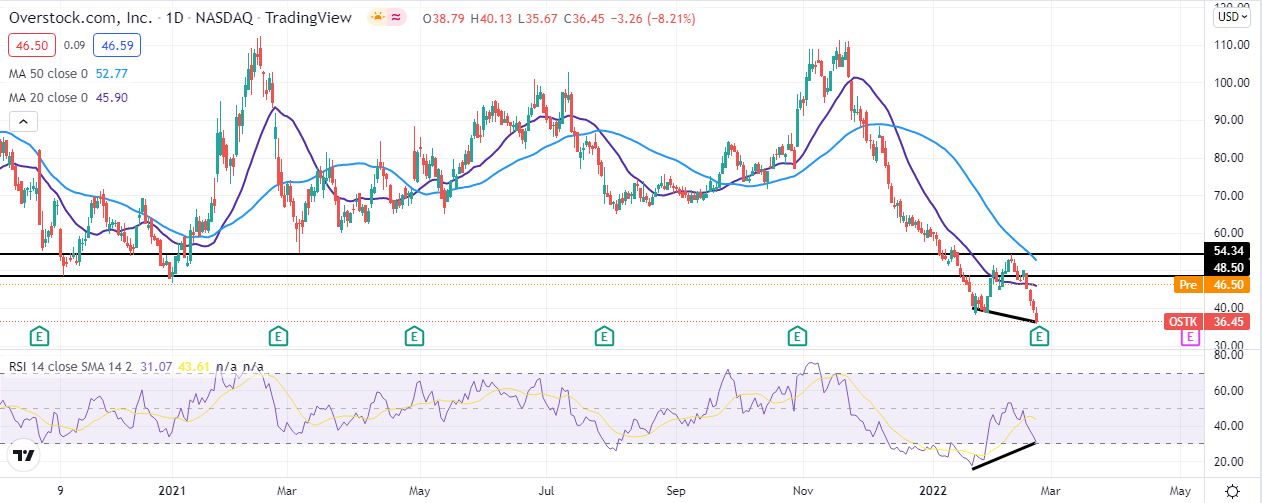
OSTK 1-day chart
Like this article? Help us with some feedback by answering this survey:
Premium
You have reached your limit of 3 free articles for this month.
Start your subscription and get access to all our original articles.
Author

Clay Webster
FXStreet
Clay Webster grew up in the US outside Buffalo, New York and Lancaster, Pennsylvania. He began investing after college following the 2008 financial crisis.


