$OR: Cosmetics manufacturer L’Oréal remains supported

L’Oréal S.A. is the world largest cosmetics and beauty company. Headquartered in Clichy, France, the field of activities concentrates on skin care, hair color, perfume, make-up, hair care, sun protection etc. L’Oréal is a part of Euro Stoxx 50 (SX5E) and CAC40 indices. Investors can trade it under the ticker $OR at Euronext Paris.
In the initial article from July 2020, we have forecasted more strength against 195.70 lows. We were right. As a matter of fact, we see l’Oréal trading at 432 which means that $OR prices have doubled within less than 3 years. Currently, we expect short term strength to continue. However, there are signs for a larger correction to be happening soon. In the current blog, we discuss the wave structure, cycles and the next buying opportunities in l’Oréal.
L’Oréal monthly Elliott Wave analysis 04.26.2023
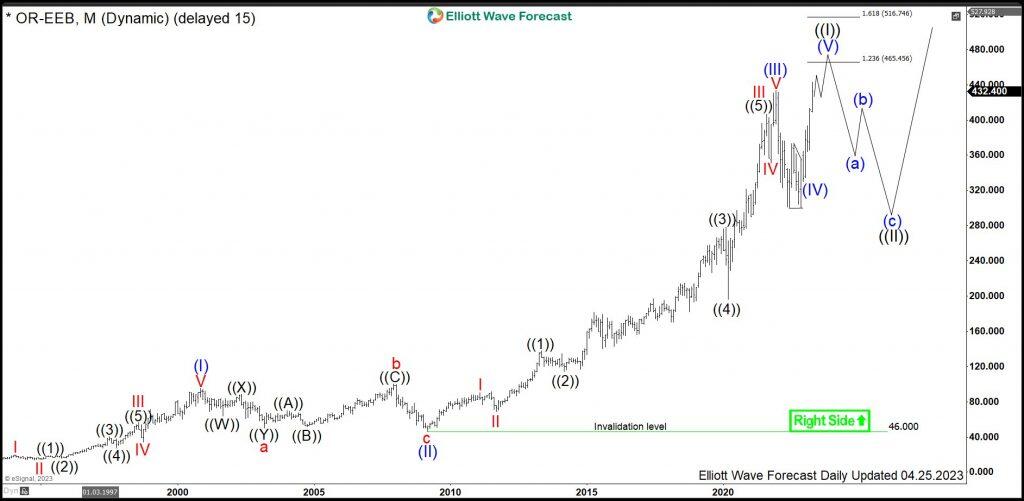
The monthly chart below shows l’Oréal stock $OR listed at Euronext. From the all-time lows, first, the stock price has developed a cycle higher in wave (I) of a super cycle degree. It is clearly an impulsive move consisting of 5 subwaves. Thereafter, a correction lower in wave (II) has unfolded as an Elliott Wave expanded flat pattern. It is a 3-3-5 pattern which has printed an important bottom on February 2009 at 46.0.
From the February 2009 lows, l’Oréal has accomplished an impressive rally. The rise towards December 2021 peak shows an extension of more than 2.618 multiples in relation to the length of the wave (I). Without any doubt, it qualifies the cycle to become the wave (III). It has ended at 433.65. From there, a pullback in wave (IV) has unfolded as a triangle. A thrust in wave (V) to the upside might become the final push. The target is 465.45-516.74 area. As a matter of fact, soon $OR will show fully developed 5 waves from the all-time lows. There, the entire cycle in black wave ((I)) might end and a larger pullback in black wave ((II)) should correct against the all-time lows. Only then, a new bullish cycle in black wave ((III)) can start.
L’Oréal daily Elliott Wave analysis 04.26.2023
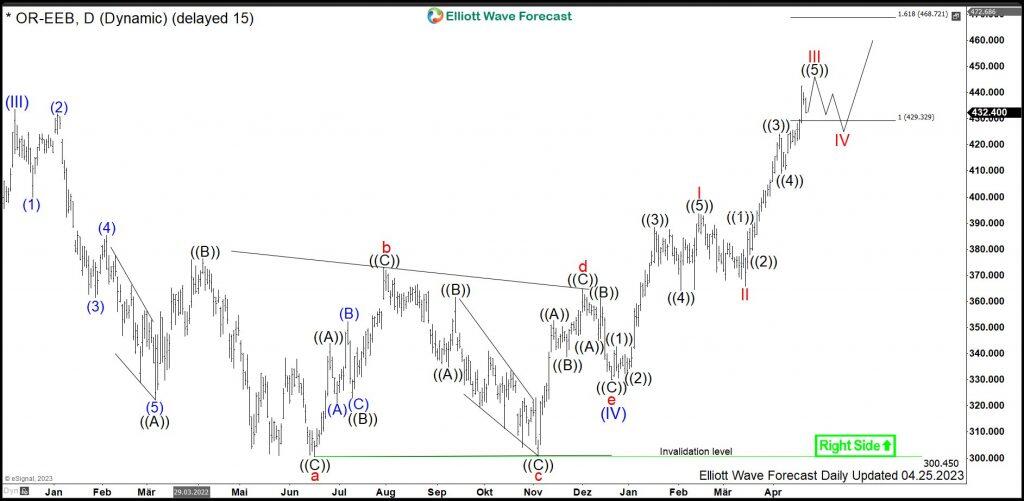
The weekly chart below shows in more detail the correction of wave (III) within a triangle in wave (IV) and a thrust to the upside in blue wave (V). From December 2021 highs at 433.65, a zigzag lower in red wave a has printed a bottom in June 2022 at 300.45. Then a bounce in red wave b has set a high in July 2022 at 373.00. From there, waves c-d-e of the triangle structure show a converging price action. RSI readings support the triangle idea. It is the preferred view, that wave (IV) has ended in December 2022 at 330.00 lows. From there, thrust in blue wave (V) has been confirmed by breaking above December 2021 high. Currently, red waves I-II have ended, while above 365.80, wave III is expected to extend and can reach higher within 429.32-468.72 area and go even beyond.
Short term traders can be still looking to buy pullbacks within wave III against 365.80 lows, expecting wave III to extend. Also, pullback in wave IV should find support for more upside in wave V. The target will be 465.45-516.74 area. For investors, on the other hand, it is time to become cautious. Indeed, the cycle in black wave ((I)) looks mature and a correction against all-time lows should happen soon. Therefore, investors do better to wait for a larger pullback in 3, 7, 11 swings against all-time lows. Monthly chart shows the idea of buying lower in 3 swings.
Author

Elliott Wave Forecast Team
ElliottWave-Forecast.com


