|

Oil technical analysis: WTI collapses below $55 barrel as Trump adds fuel to the trade war fire

  • WTI is impacted hard as Trump plans to impose more tariffs on China. 
  • The levels to beat for bears are seen at 54.00 and $53.00 a barrel.
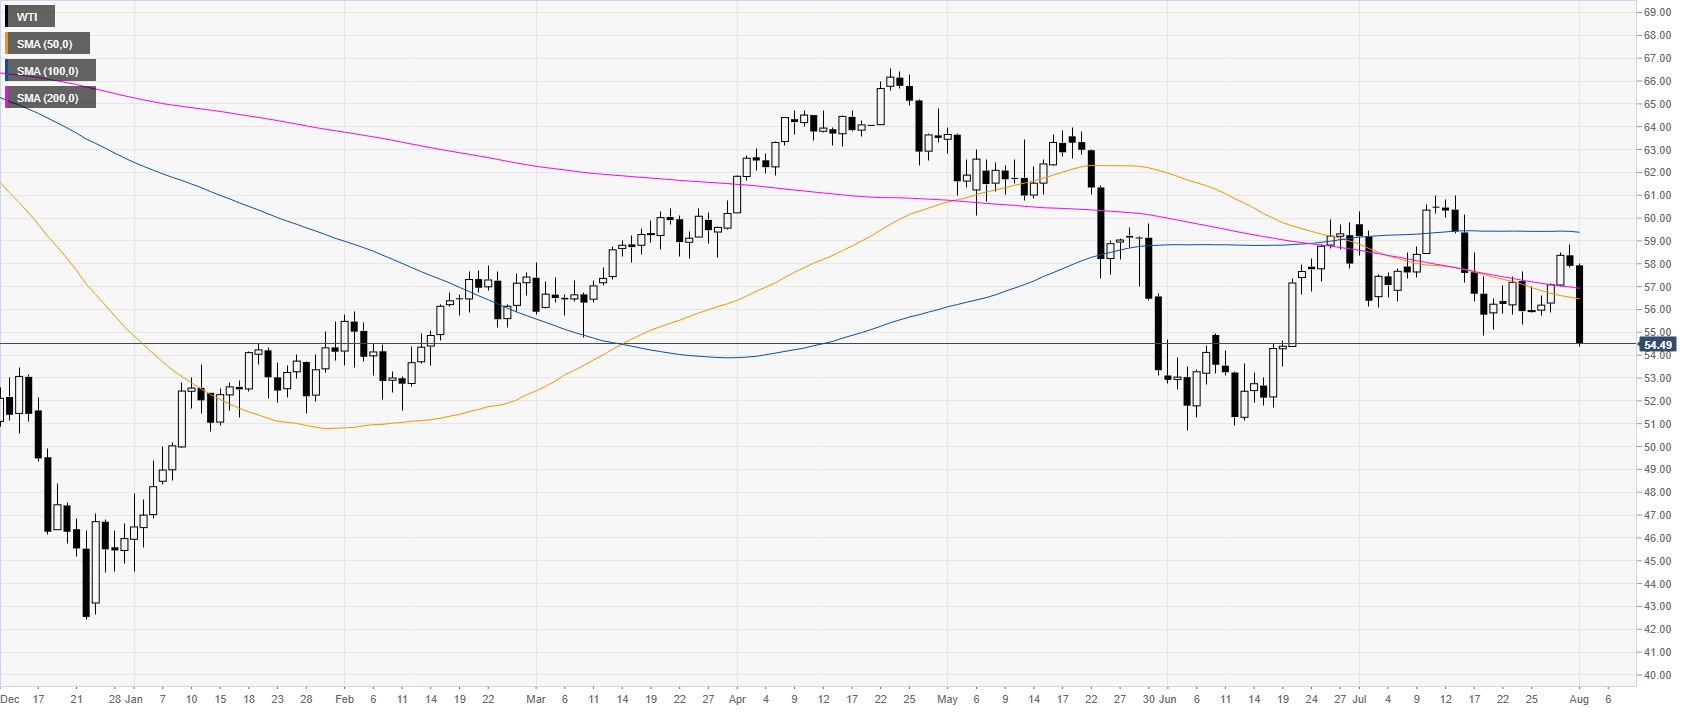
 

Oil daily chart

 
WTI (West Texas Intermediate) is down almost $4 this Thursday trading below its main daily simple moving averages (DSMA) as US President Trump plan to impose additional 10% tariff on remaining $300 bln of Chinese imports to US starting Sept 1.
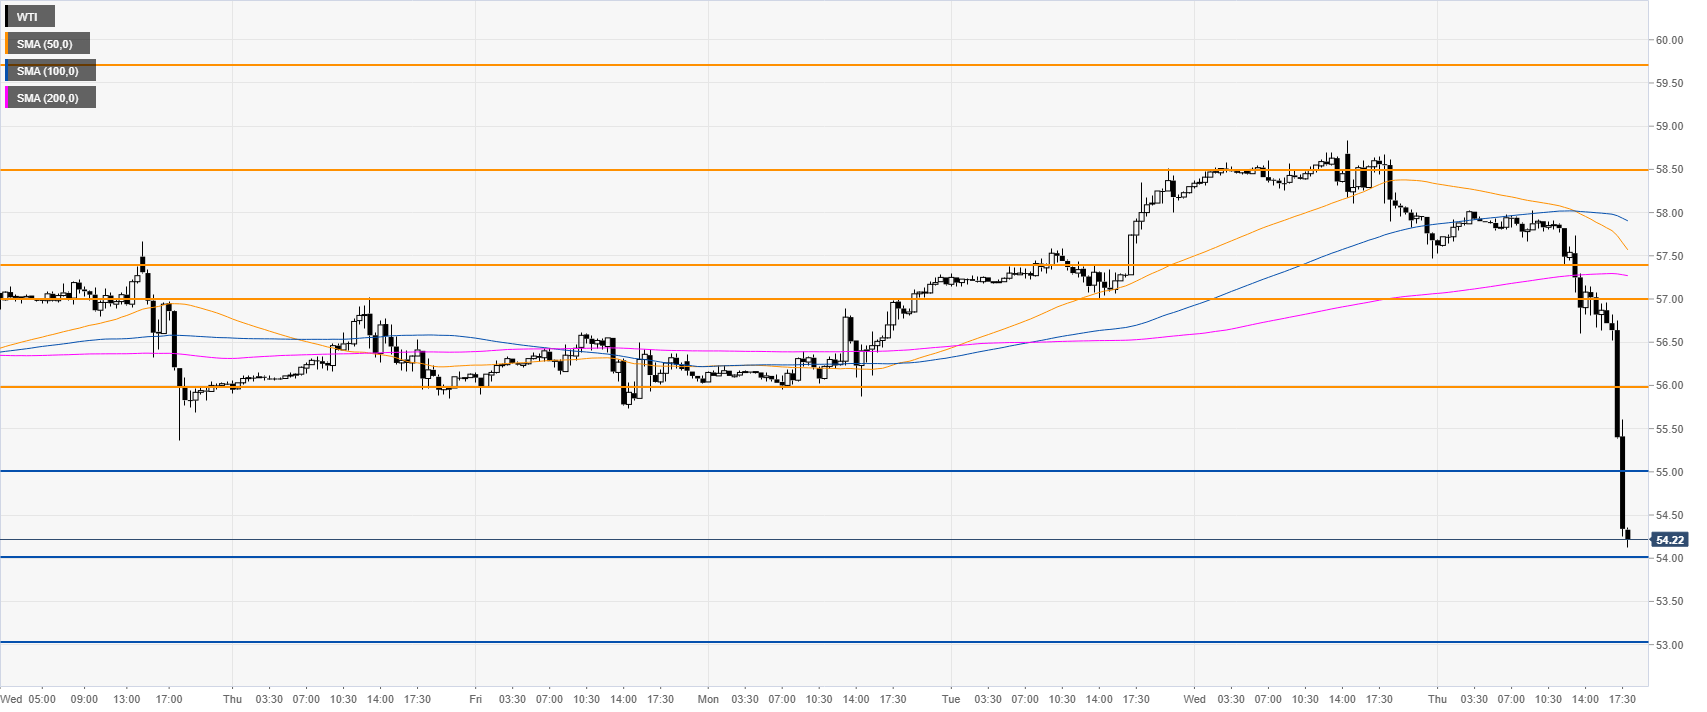
 

Oil 30-minute chart

 
WTI is slicing through many layers of supports as the sellers are being relentless. The next potential supports to watch for can be located at the 54.00 and 53.00 level. 


Additional key levels

WTI

Overview
Today last price54.32
Today Daily Change-3.59
Today Daily Change %-6.20
Today daily open57.91
 
Trends
Daily SMA2057.63
Daily SMA5056.54
Daily SMA10059.42
Daily SMA20056.57
Levels
Previous Daily High58.84
Previous Daily Low57.83
Previous Weekly High57.66
Previous Weekly Low55.36
Previous Monthly High60.99
Previous Monthly Low54.87
Daily Fibonacci 38.2%58.22
Daily Fibonacci 61.8%58.45
Daily Pivot Point S157.55
Daily Pivot Point S257.18
Daily Pivot Point S356.54
Daily Pivot Point R158.56
Daily Pivot Point R259.2
Daily Pivot Point R359.57

Author

Flavio Tosti

Flavio Tosti

Independent Analyst


More from Flavio Tosti
Share:

Editor's Picks

EUR/USD deflates to fresh lows, targets 1.1600

The selling pressure on EUR/USD now gathers extra pace, prompting the pair to hit fresh multi-week lows in the 1.1625-1.1620 band on Friday. The continuation of the downward bias comes in response to further gains in the US Dollar as market participants continue to assess the mixed release of US Nonfarm Payrolls in December.

GBP/USD breaks below 1.3400, challenges the 200-day SMA

GBP/USD remains under heavy fire and retreats for the fourth consecutive day on Friday. Indeed, Cable suffers the strong performance of the Greenback, intensified post-mixed NFP, and trades at shouting distance from its critical 200-day SMA near 1.3380.

Gold flirts with yearly tops around $4,500

Gold keeps its positive bias on Friday, adding to Thursday’s advance and challenging yearly highs in the $4,500 region per troy ounce. The risk-off sentiment favours the yellow metal despite the firmer tone in the Greenback and rising US Treasury yields.

Crypto Today: Bitcoin, Ethereum, XRP risk further decline as market fear persists amid slowing demand

Bitcoin holds $90,000 but stays below the 50-day EMA as institutional demand wanes. Ethereum steadies above $3,000 but remains structurally weak due to ETF outflows. XRP ETFs resume inflows, but the price struggles to gain ground above key support.

Week ahead – US CPI might challenge the geopolitics-boosted Dollar

Geopolitics may try to steal the limelight from US data. A possible US Supreme Court ruling on tariffs could dictate market movements. A crammed data calendar next week, US CPI comes on Tuesday; Fedspeak to intensify.

XRP trades under pressure amid weak retail demand

XRP presses down on the 50-day EMA support as risk-averse sentiment spreads despite a positive start to 2026. XRP faces declining retail demand, as reflected in futures Open Interest, which has fallen to $4.15 billion.