|

Oil Technical Analysis: Black Gold breaks to 2-month’s high flirting with $55.00 a barrel opening the gates to 62.00 target
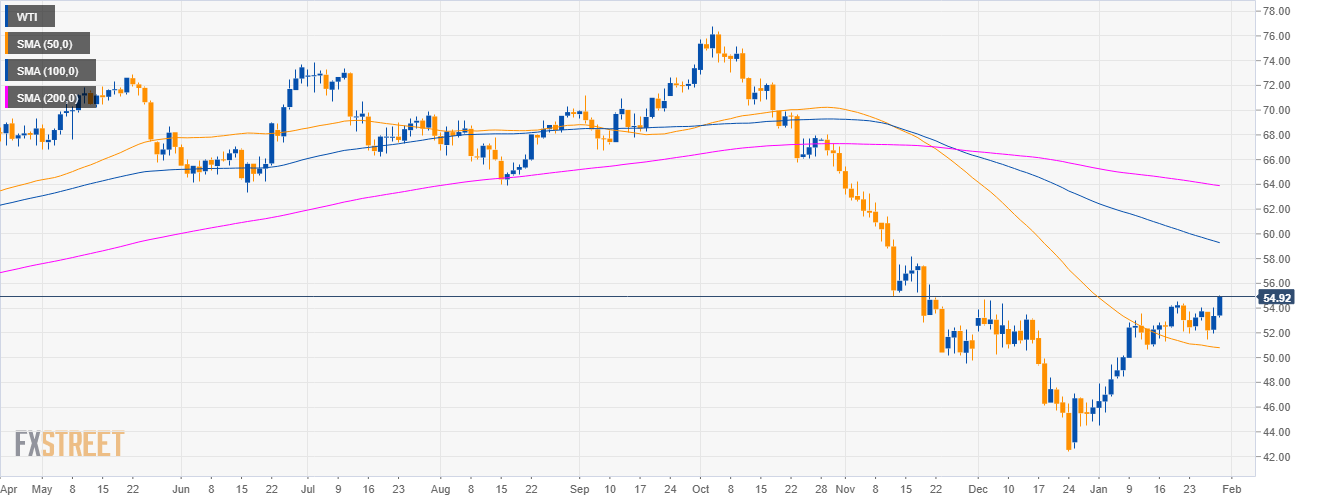
Oil daily chart

  • Crude oil WTI is trading below its 200-day simple moving average.
  • The weekly EIA Crude Oil Stocks change this wednesday reported a draw of 0.919 Million barrel against 3 Million expected by analysts, sending black gold to 2-month’s highs.
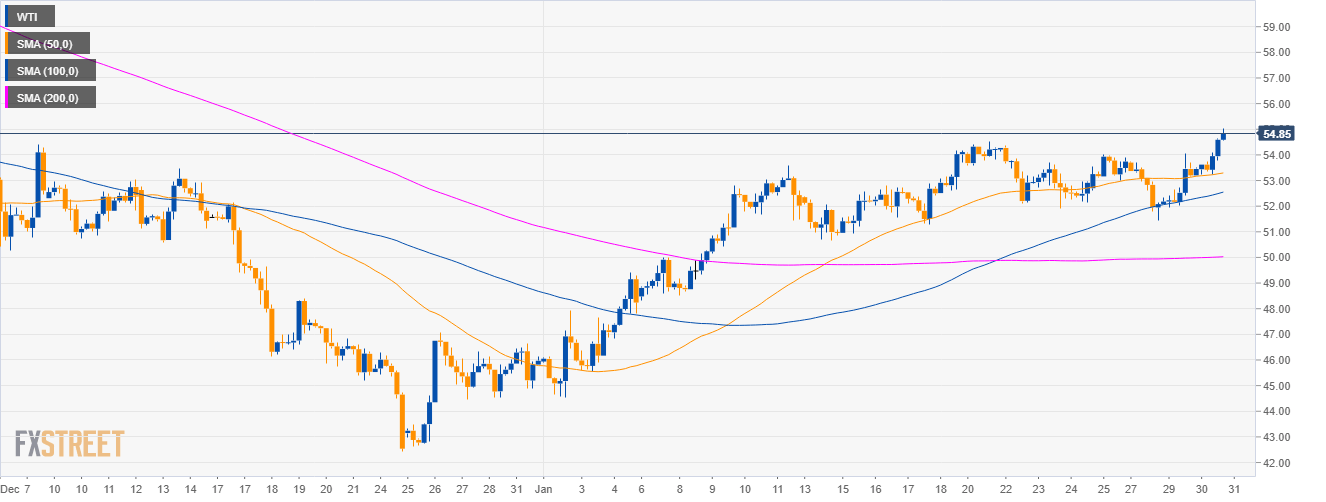
Oil 4-hour chart

  • WTI is trading above its main SMAs suggesting bullish momentum in the medium-term. 
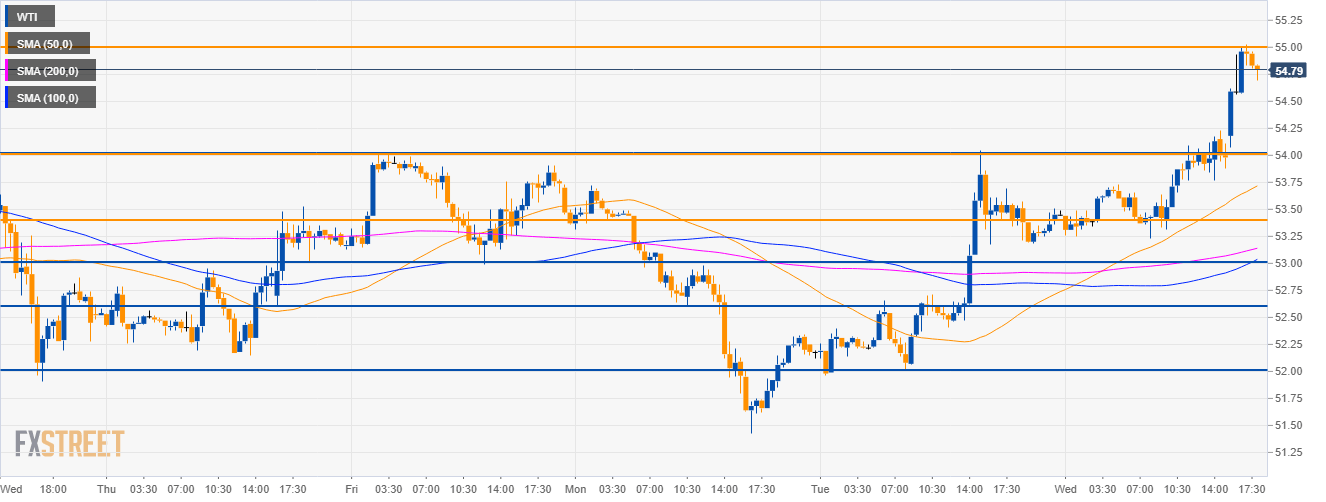
Oil 30-minute chart

  • While corrective moves down in the short term can be expected, the bulls are in control and WTI could reach $62.00 a barrel in the coming weeks/months.

Additional key levels

WTI

Overview:
    Today Last Price: 54.83
    Today Daily change: 147 points
    Today Daily change %: 2.75%
    Today Daily Open: 53.36
Trends:
    Daily SMA20: 51.9
    Daily SMA50: 50.57
    Daily SMA100: 58.47
    Daily SMA200: 63.6
Levels:
    Previous Daily High: 54.04
    Previous Daily Low: 51.96
    Previous Weekly High: 54.51
    Previous Weekly Low: 51.91
    Previous Monthly High: 54.68
    Previous Monthly Low: 42.45
    Daily Fibonacci 38.2%: 53.25
    Daily Fibonacci 61.8%: 52.75
    Daily Pivot Point S1: 52.2
    Daily Pivot Point S2: 51.04
    Daily Pivot Point S3: 50.12
    Daily Pivot Point R1: 54.28
    Daily Pivot Point R2: 55.2
    Daily Pivot Point R3: 56.36

Author

Flavio Tosti

Flavio Tosti

Independent Analyst


More from Flavio Tosti
Share:

Editor's Picks

EUR/USD remains offered below 1.1600, seems vulnerable near multi-month low

The EUR/USD pair struggles to capitalize on the overnight bounce from the 1.1530 region, or the lowest level since November 2025, and lower for the third consecutive day on Wednesday. Spot prices slide back below the 1.1600 mark during the Asian session and seem vulnerable to slide further.

GBP/USD slips below key averages as geopolitical risks mount

GBP/USD fell about 0.35% on Tuesday, settling around 1.3350 after slipping below the 200-day Exponential Moving Average for the first time since early December. The pair has pulled back sharply from its late-January high near 1.3870, shedding over 500 pips in a series of lower highs and lower lows. 

Gold rebounds ahead of US ADP, will it last?

Gold finds renewed Asian bids and retests $5,230 early Wednesday after the heavy sell-off on Tuesday. The US Dollar stands tall amid escalating Middle East tensions and reduced dovish Fed expectations. Gold defends $5,000 or 50% Fibo level after facing rejection at the 78.6% Fibo resistance at $5,342 amid bullish RSI.  

Ethereum: Whales step up buying as short positions contract

After holding firm heading into the last weekend, Ethereum whales have returned to action, pouncing on the volatility stemming from escalating military actions between the US and Iran.

Energy shock 2.0: Why rising Gas prices could hit the Euro

Even without a confirmed, sustained disruption, the mere risk to a key global energy chokepoint is enough to inject a significant premium into European Gas markets. And for the Euro, that matters.

Ripple falters amid sell-off jitters and negative funding rates

Ripple (XRP) has come under pressure, drifting lower to $1.35 at the time of writing on Tuesday. The over 2% correction looks poised to erase the previous day’s gains, which lifted the remittance token to $1.42.