• API inventories show another massive draw of -8.322mln barrels.
  • OPEC+ may temper supply restart with extra oil cuts from cheats.

API weekly data and OPEC+ developments

The latest weekly American Petroleum Institute (API) weekly data shows crude stocks fells -8.322 mln. Inventory at Cushing Oaklahoma increased by 0.548 mln. Gasoline stocks declined by -3.611 mln and distillate stocks produced a build of 3.030 mln.

There has been a slew of comments ahead of the OPEC JMMC meeting on Wednesday with the latest reports suggesting the cartel may keep an 842k barrel per day cut in August and September. This would be considered due to some members who did not fully comply with the OPEC+ cut arrangement. The finalisation of these cuts will be outlined on Wednesday at the JMMC meeting. 

Elsewhere here are some of the key headlines from the OPEC report earlier in the session:

  • Global oil demand to surge in 2021.
  • Non-OPEC supply will be slower to recover: 
  • OPEC pumped 22.27 million b/d in June.
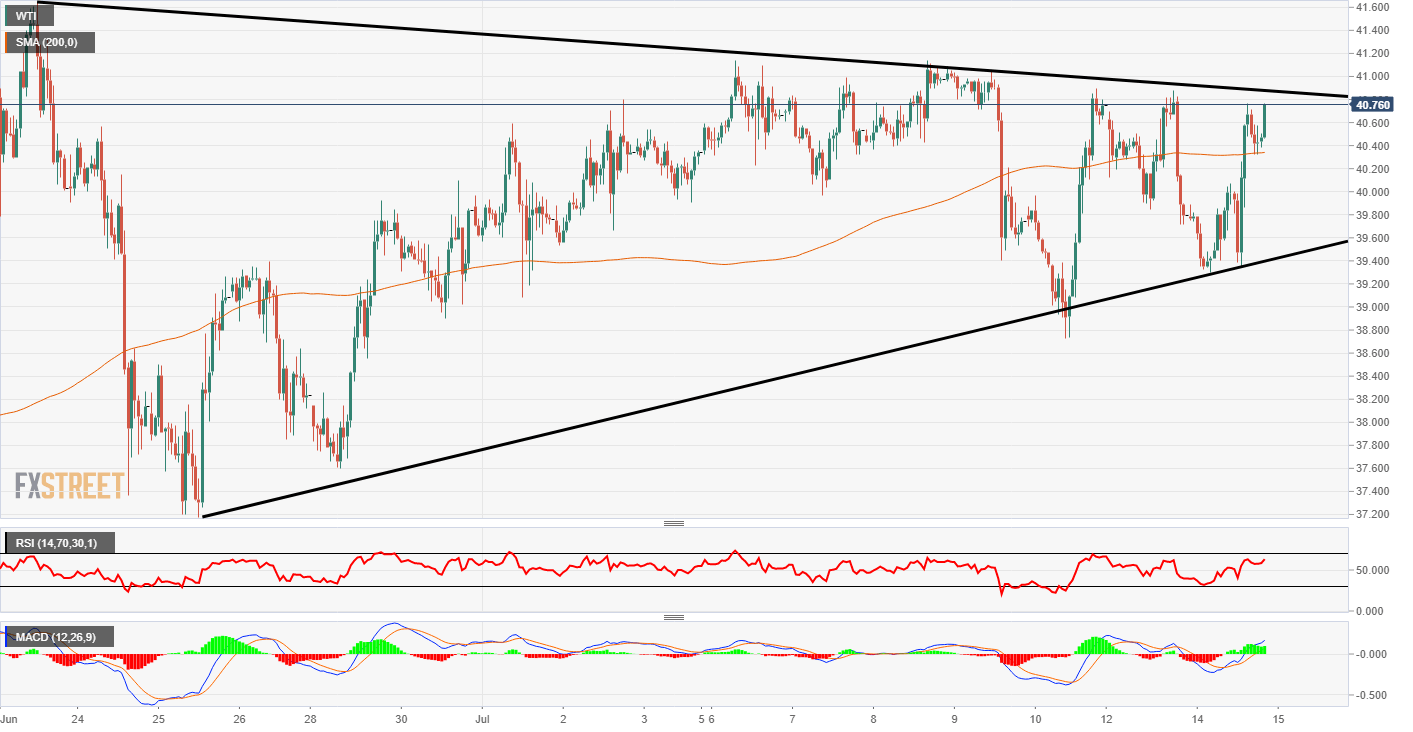
WTI 1-hour chart

In an initial reaction, WTI prices shot up to reach USD 40.19 per barrel on Tuesday. This is a 2.25% increase on the session and interesting as earlier on in the day prices were struggling down at USD 38.70 per barrel. The top of the pattern on the chart below could be tested and if it is broken then the highs at USD 40.39 could be next. That would also mean a break of the recent range highs. Overall it seems this uptrend is still intact for now. 

WTI Chart

Additional levels

WTI

Overview
Today last price 40.5
Today Daily Change  0.71
Today Daily Change % 1.78 
Today daily open 39.79
 
Trends
Daily SMA20 39.66
Daily SMA50 35.56
Daily SMA100 32.65
Daily SMA200 44.51
 
Levels
Previous Daily High 40.87
Previous Daily Low 39.71
Previous Weekly High 41.14
Previous Weekly Low 38.73
Previous Monthly High 41.65
Previous Monthly Low 34.45
Daily Fibonacci 38.2% 40.16
Daily Fibonacci 61.8% 40.43
Daily Pivot Point S1 39.38
Daily Pivot Point S2 38.97
Daily Pivot Point S3 38.22
Daily Pivot Point R1 40.54
Daily Pivot Point R2 41.29
Daily Pivot Point R3 41.7


Share: Feed news

All information and content on this website, from this website or from FX daily ltd. should be viewed as educational only. Although the author, FX daily ltd. and its contributors believe the information and contents to be accurate, we neither guarantee their accuracy nor assume any liability for errors. The concepts and methods introduced should be used to stimulate intelligent trading decisions. Any mention of profits should be considered hypothetical and may not reflect slippage, liquidity and fees in live trading. Unless otherwise stated, all illustrations are made with the benefit of hindsight. There is risk of loss as well as profit in trading. It should not be presumed that the methods presented on this website or from material obtained from this website in any manner will be profitable or that they will not result in losses. Past performance is not a guarantee of future results. It is the responsibility of each trader to determine their own financial suitability. FX daily ltd. cannot be held responsible for any direct or indirect loss incurred by applying any of the information obtained here. Futures, forex, equities and options trading contains substantial risk, is not for every trader, and only risk capital should be used. Any form of trading, including forex, options, hedging and spreads, contains risk. Past performance is not indicative of future FX daily ltd. are not Registered Financial Investment Advisors, securities brokers-dealers or brokers of the U.S. Securities and Exchange Commission or with any state securities regulatory authority OR UK FCA. We recommend consulting with a registered investment advisor, broker-dealer, and/or financial advisor. If you choose to invest, with or without seeking advice, then any consequences resulting from your investments are your sole responsibility FX daily ltd. does not assume responsibility for any profits or losses in any stocks, options, futures or trading strategy mentioned on the website, newsletter, online trading room or trading classes. All information should be taken as educational purposes only.

Recommended content


Recommended content

Editors’ Picks

EUR/USD holds above 1.0650 after US data

EUR/USD holds above 1.0650 after US data

EUR/USD retreats from session highs but manages to hold above 1.0650 in the early American session. Upbeat macroeconomic data releases from the US helps the US Dollar find a foothold and limits the pair's upside.

EUR/USD News

GBP/USD retreats toward 1.2450 on modest USD rebound

GBP/USD retreats toward 1.2450 on modest USD rebound

GBP/USD edges lower in the second half of the day and trades at around 1.2450. Better-than-expected Jobless Claims and Philadelphia Fed Manufacturing Index data from the US provides a support to the USD and forces the pair to stay on the back foot.

GBP/USD News

Gold is closely monitoring geopolitics

Gold is closely monitoring geopolitics

Gold trades in positive territory above $2,380 on Thursday. Although the benchmark 10-year US Treasury bond yield holds steady following upbeat US data, XAU/USD continues to stretch higher on growing fears over a deepening conflict in the Middle East.

Gold News

Ripple faces significant correction as former SEC litigator says lawsuit could make it to Supreme Court

Ripple faces significant correction as former SEC litigator says lawsuit could make it to Supreme Court

Ripple (XRP) price hovers below the key $0.50 level on Thursday after failing at another attempt to break and close above the resistance for the fourth day in a row. 

Read more

Have we seen the extent of the Fed rate repricing?

Have we seen the extent of the Fed rate repricing?

Markets have been mostly consolidating recent moves into Thursday. We’ve seen some profit taking on Dollar longs and renewed demand for US equities into the dip. Whether or not this holds up is a completely different story.

Read more

Forex MAJORS

Cryptocurrencies

Signatures