Oil snaps winning streak ahead of API release
- Oil retreats back below $80 and ends winning streak.
- Pressure in Oil markets is rising ahead of the OPEC+ meeting in June.
- The US Dollar Index edges up towards 104.50 after the Fed’s Kashkari hawkish comments.

Oil prices are pulling back and are even falling in the red this Wednesday, despite tensions building up towards the OPEC+ meeting at the beginning of June. Recent reports from Bloomberg Intelligence are pointing to an Oil deficit for the second half of 2024 in case OPEC+ maintains the current production cuts in place. Meanwhile, OPEC+ itself is undercutting its own efforts amid reports that several OPEC members are not adhering to their promised production cuts.
Meanwhile, the US Dollar Index (DXY), which tracks the performance of the US Dollar against a basket of six major currencies, trades stronger after Minneapolis Federal Reserve President Neel Kashkari spooked markets by floating the idea that a rate hike is still on the cards. This pushed markets into risk-off mood, with equities dropping lower and the Greenback moving higher against its main peers.
At the time of writing, Crude Oil (WTI) trades at $79.60 and Brent Crude at $83.87.
Oil news and market movers: Nervousness for API
- This Wednesday, the American Petroleum Institute will release the recent Crude stock pile change numbers, near 20:30 GMT. Previous print was a build of 2.48 million barrels.
- Chinese Oil buyers are warning of less demand as they slash their production rates with the current Chinese housing market crisis and overall less demand for plastics due to ESG push in Europe and the US.
- Bloomberg reports that OPEC has been using active supply management in order to keep Oil prices supported.
- UBS strategists issued a note on Wednesday, favoring investments in Oil over Gold with more upside potential for Oil against precious metals.
- Tensions remain elevated in the Middle East with Israel’s opposition parties reportedly looking for ways to oust current Prime Minister Benjamin Netanyahu.
Oil Technical Analysis: Testing support
Oil prices have recovered in recent days, printing a new fresh high for May right at the end of month. Although it might look tempting for traders to jump, risk of upside resistance is ample and this build up could be a classic “buy the rumor, sell the fact” type of event, with the possibility that the upcoming OPEC meeting disappoints markets.
On the upside, the 55-day Simple Moving Average (SMA) at $81.31 and the descending trendline at $81.85 are forming an area with a lot of resistance. Once broken through there, the road looks quite open to head to $87.12.
On the downside, a big support area is present with both the 100-day SMA at $78.95 and the 200-day SMA at $79.57. Adding to these, there is an ascending trendline, forming a trifecta of support levels that should avoid another steep decline. Should those levels not hold, a revisit of May’s low near $76.00 looks inevitable.
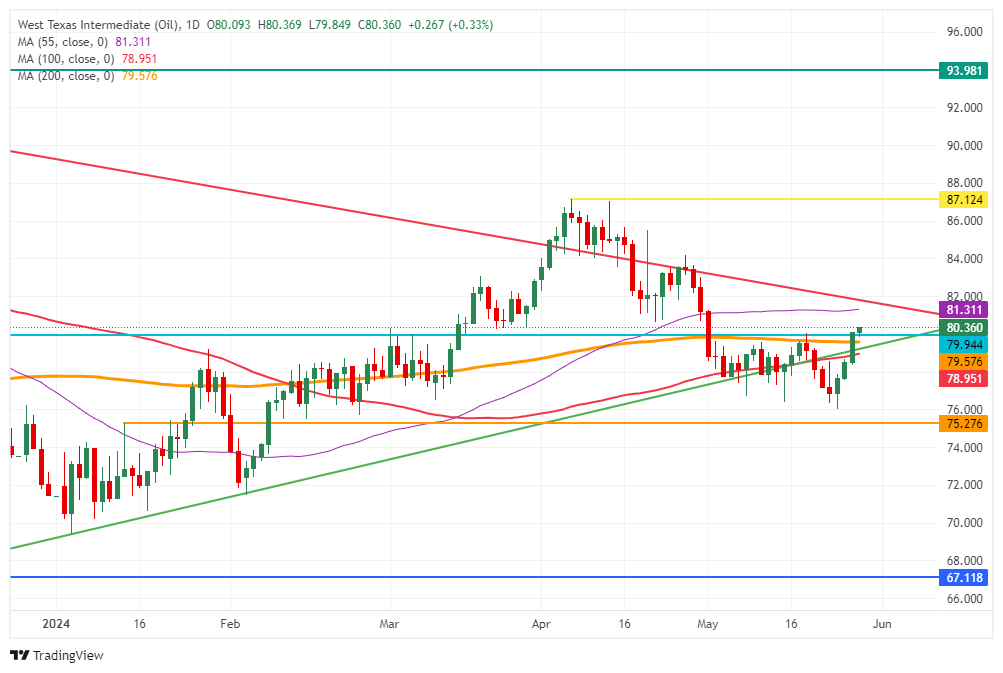
US WTI Crude Oil: Daily Chart
WTI Oil FAQs
WTI Oil is a type of Crude Oil sold on international markets. The WTI stands for West Texas Intermediate, one of three major types including Brent and Dubai Crude. WTI is also referred to as “light” and “sweet” because of its relatively low gravity and sulfur content respectively. It is considered a high quality Oil that is easily refined. It is sourced in the United States and distributed via the Cushing hub, which is considered “The Pipeline Crossroads of the World”. It is a benchmark for the Oil market and WTI price is frequently quoted in the media.
Like all assets, supply and demand are the key drivers of WTI Oil price. As such, global growth can be a driver of increased demand and vice versa for weak global growth. Political instability, wars, and sanctions can disrupt supply and impact prices. The decisions of OPEC, a group of major Oil-producing countries, is another key driver of price. The value of the US Dollar influences the price of WTI Crude Oil, since Oil is predominantly traded in US Dollars, thus a weaker US Dollar can make Oil more affordable and vice versa.
The weekly Oil inventory reports published by the American Petroleum Institute (API) and the Energy Information Agency (EIA) impact the price of WTI Oil. Changes in inventories reflect fluctuating supply and demand. If the data shows a drop in inventories it can indicate increased demand, pushing up Oil price. Higher inventories can reflect increased supply, pushing down prices. API’s report is published every Tuesday and EIA’s the day after. Their results are usually similar, falling within 1% of each other 75% of the time. The EIA data is considered more reliable, since it is a government agency.
OPEC (Organization of the Petroleum Exporting Countries) is a group of 13 Oil-producing nations who collectively decide production quotas for member countries at twice-yearly meetings. Their decisions often impact WTI Oil prices. When OPEC decides to lower quotas, it can tighten supply, pushing up Oil prices. When OPEC increases production, it has the opposite effect. OPEC+ refers to an expanded group that includes ten extra non-OPEC members, the most notable of which is Russia.
Author

Filip Lagaart
FXStreet
Filip Lagaart is a former sales/trader with over 15 years of financial markets expertise under its belt.