October's sneaky dance: Unmasking the game-changer in price action and seasonality [Video]
![October's sneaky dance: Unmasking the game-changer in price action and seasonality [Video]](https://editorial.fxstreet.com/images/TechnicalAnalysis/ChartPatterns/PointFigure/stock-market-performance-9668321_XtraLarge.jpg)
Watch the video extracted from the weekly live group coaching session on 3 Oct 2023 below to find out the following
-
How to use the up wave and down wave to judge the trend of S&P 500.
-
How to form a directional bias with price action in conjunction with the October's seasonality?
-
How to interpret the downward momentum with the price action?
-
What key level should investors pay attention to in order to gauge the S&P 500 direction
-
And a lot more.
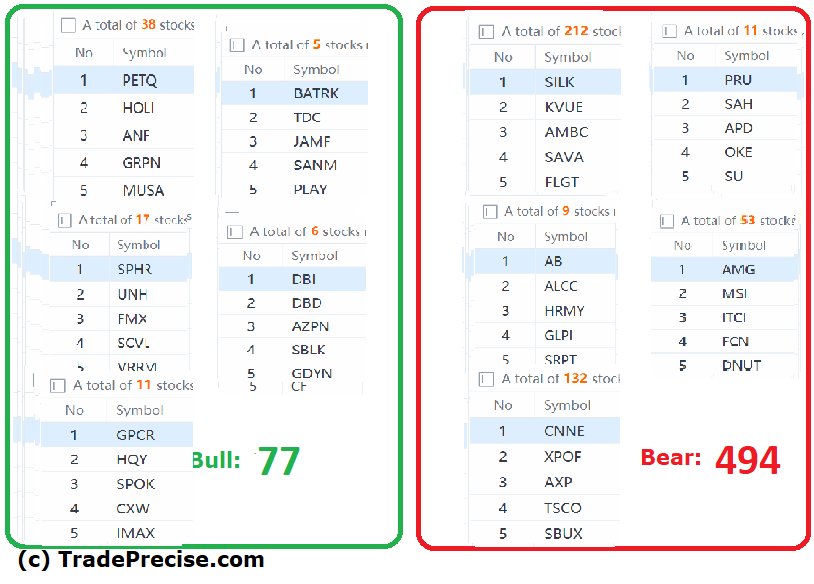
The bullish vs. bearish setup is 77 to 494 from the screenshot of my stock screener below pointing to a very negative market environment.
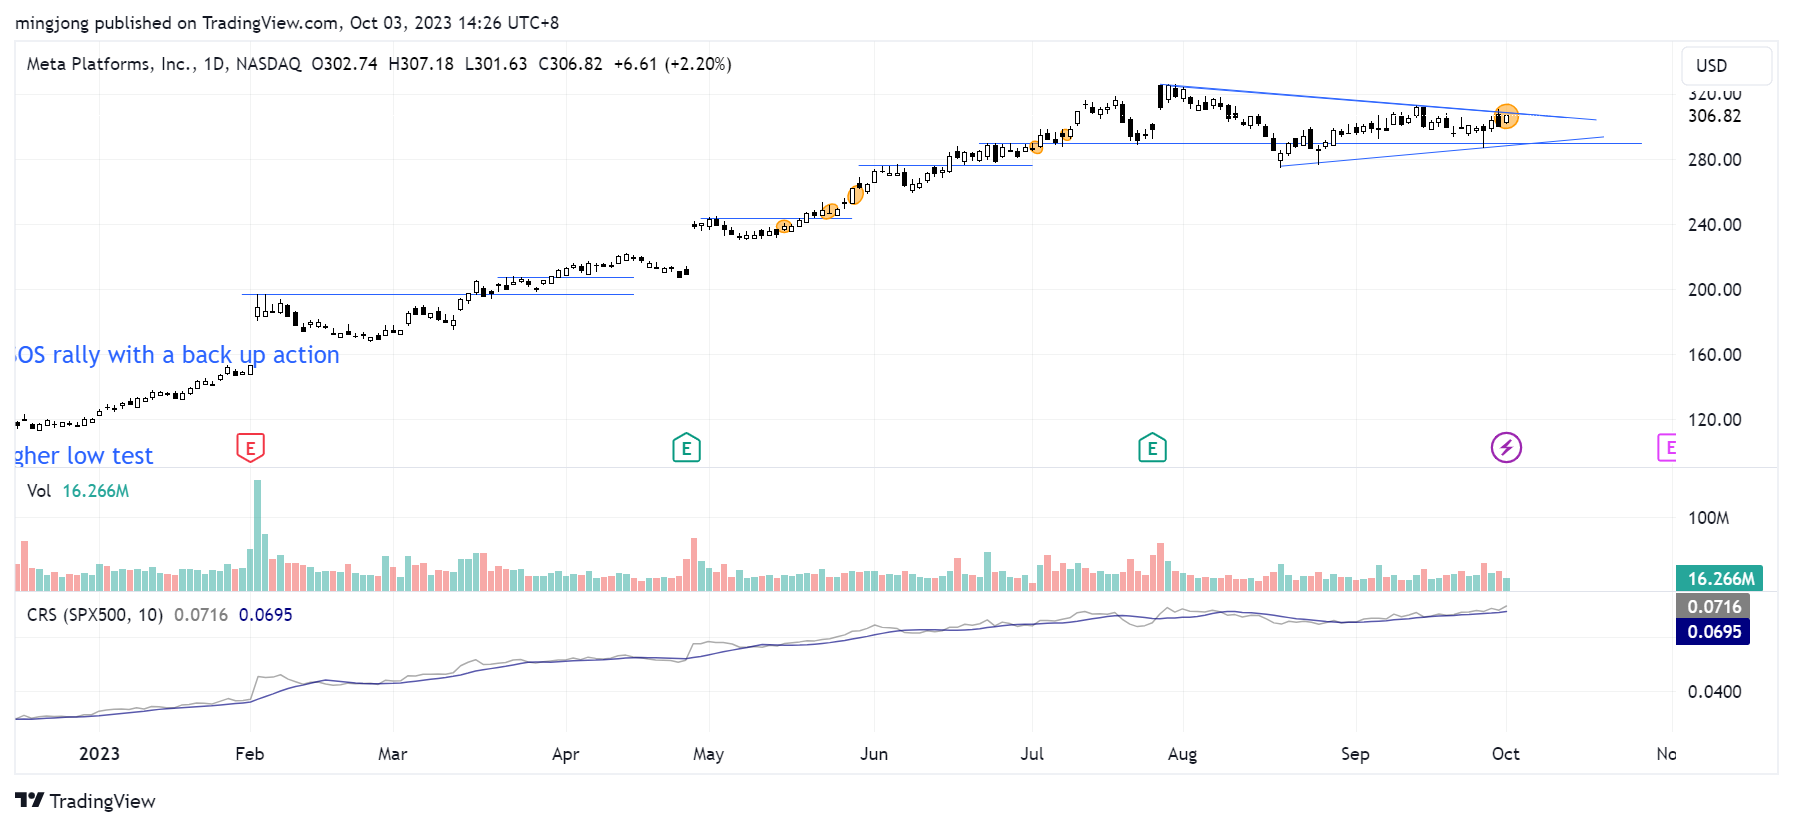
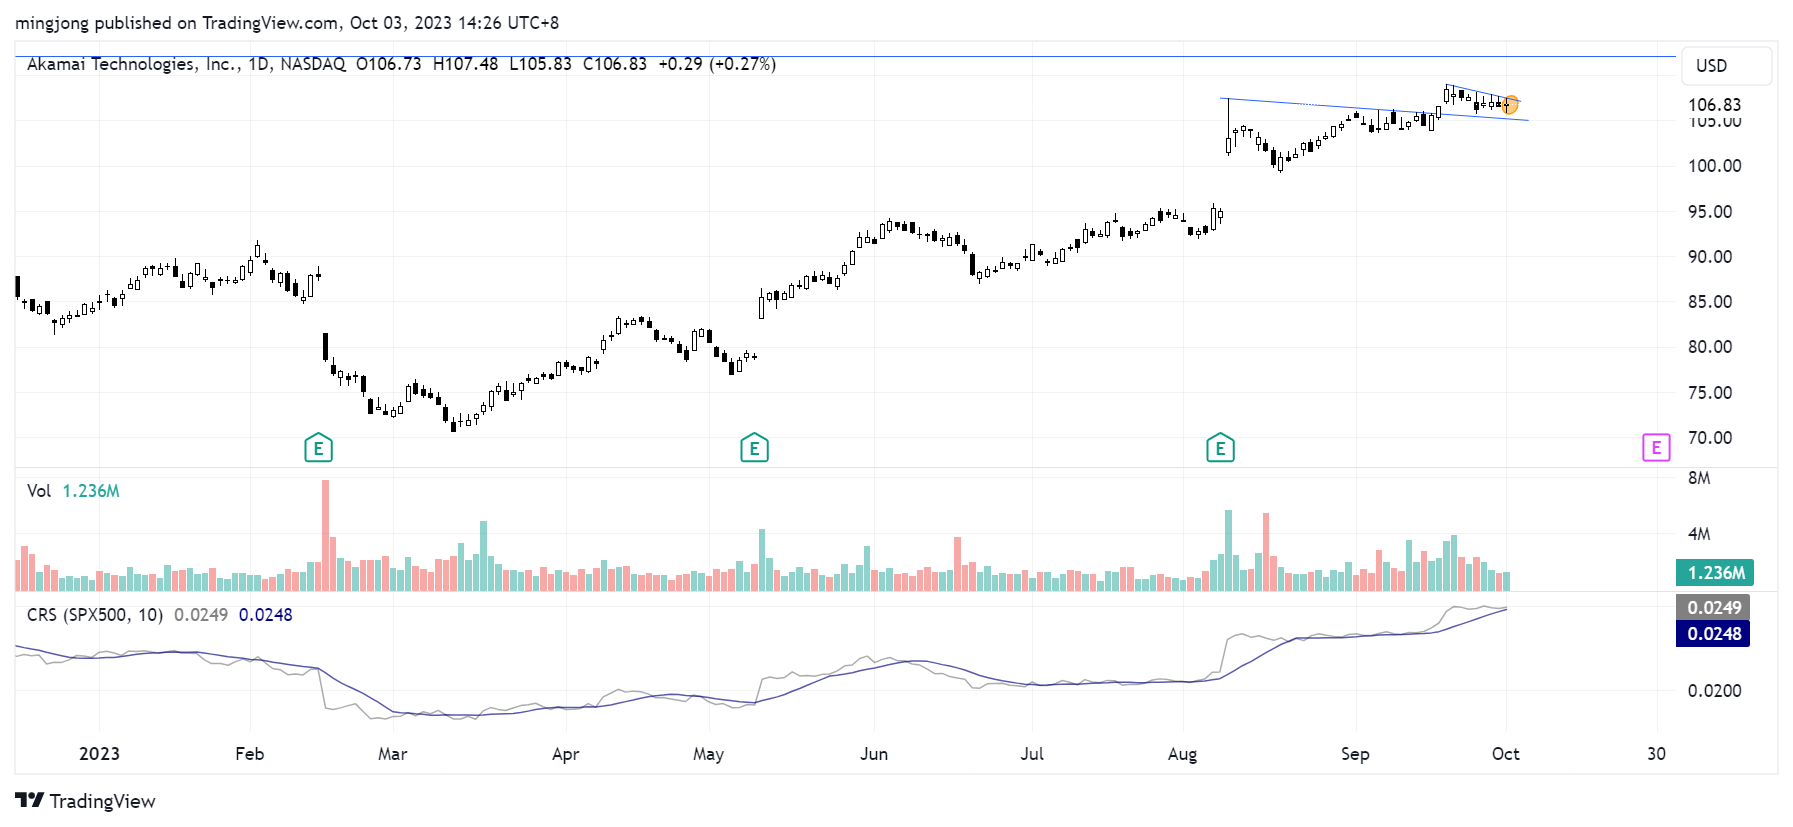
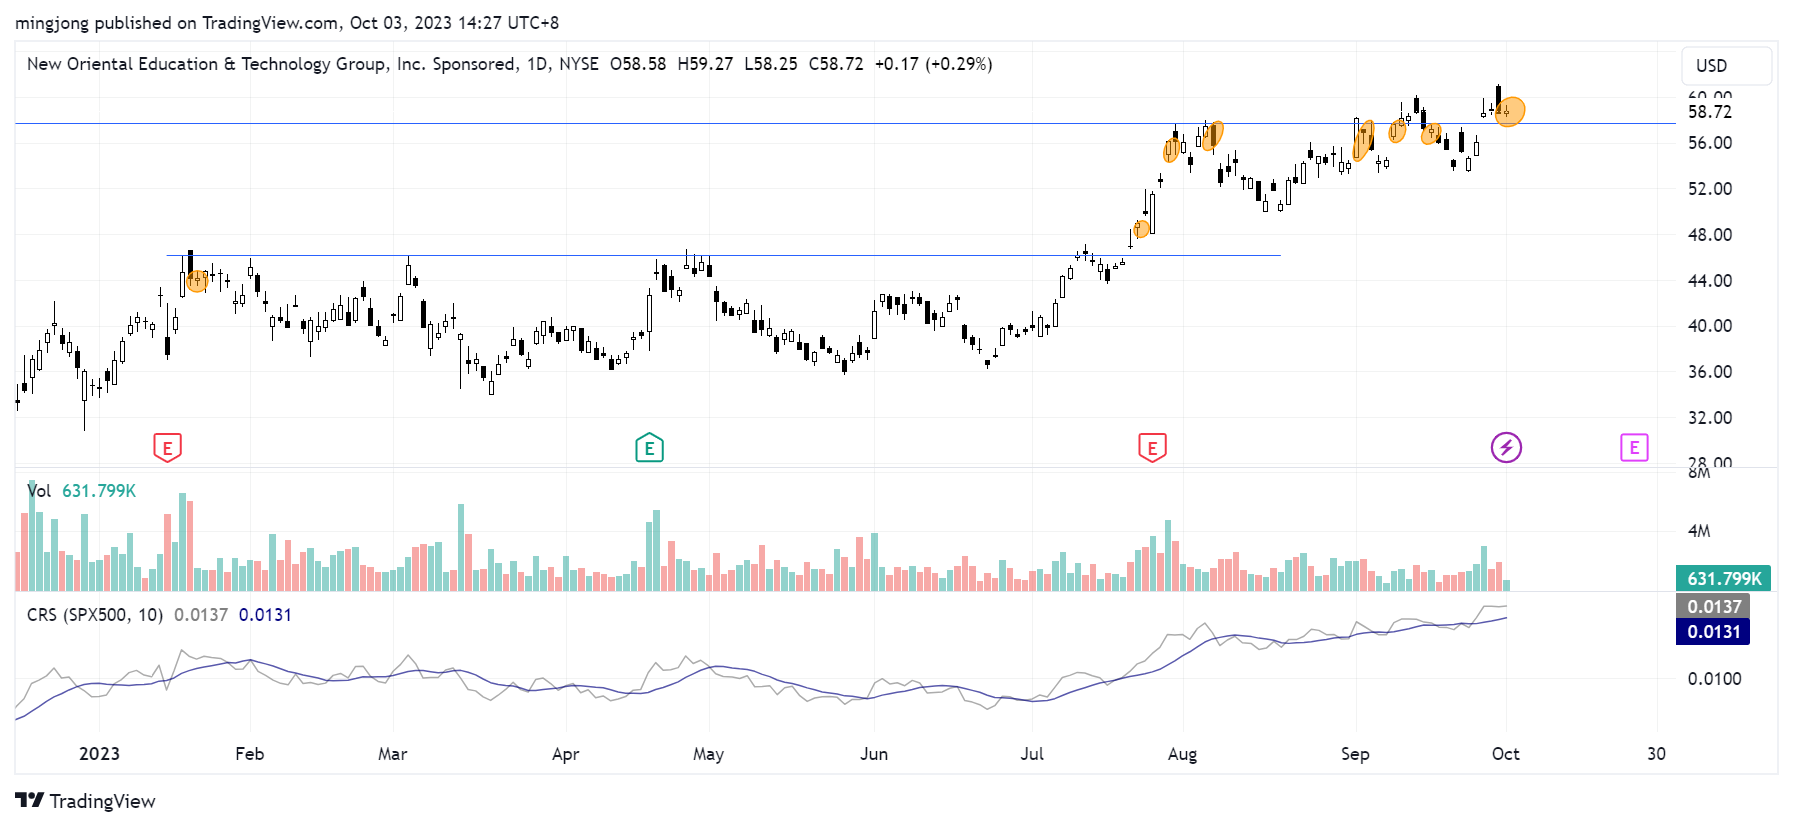
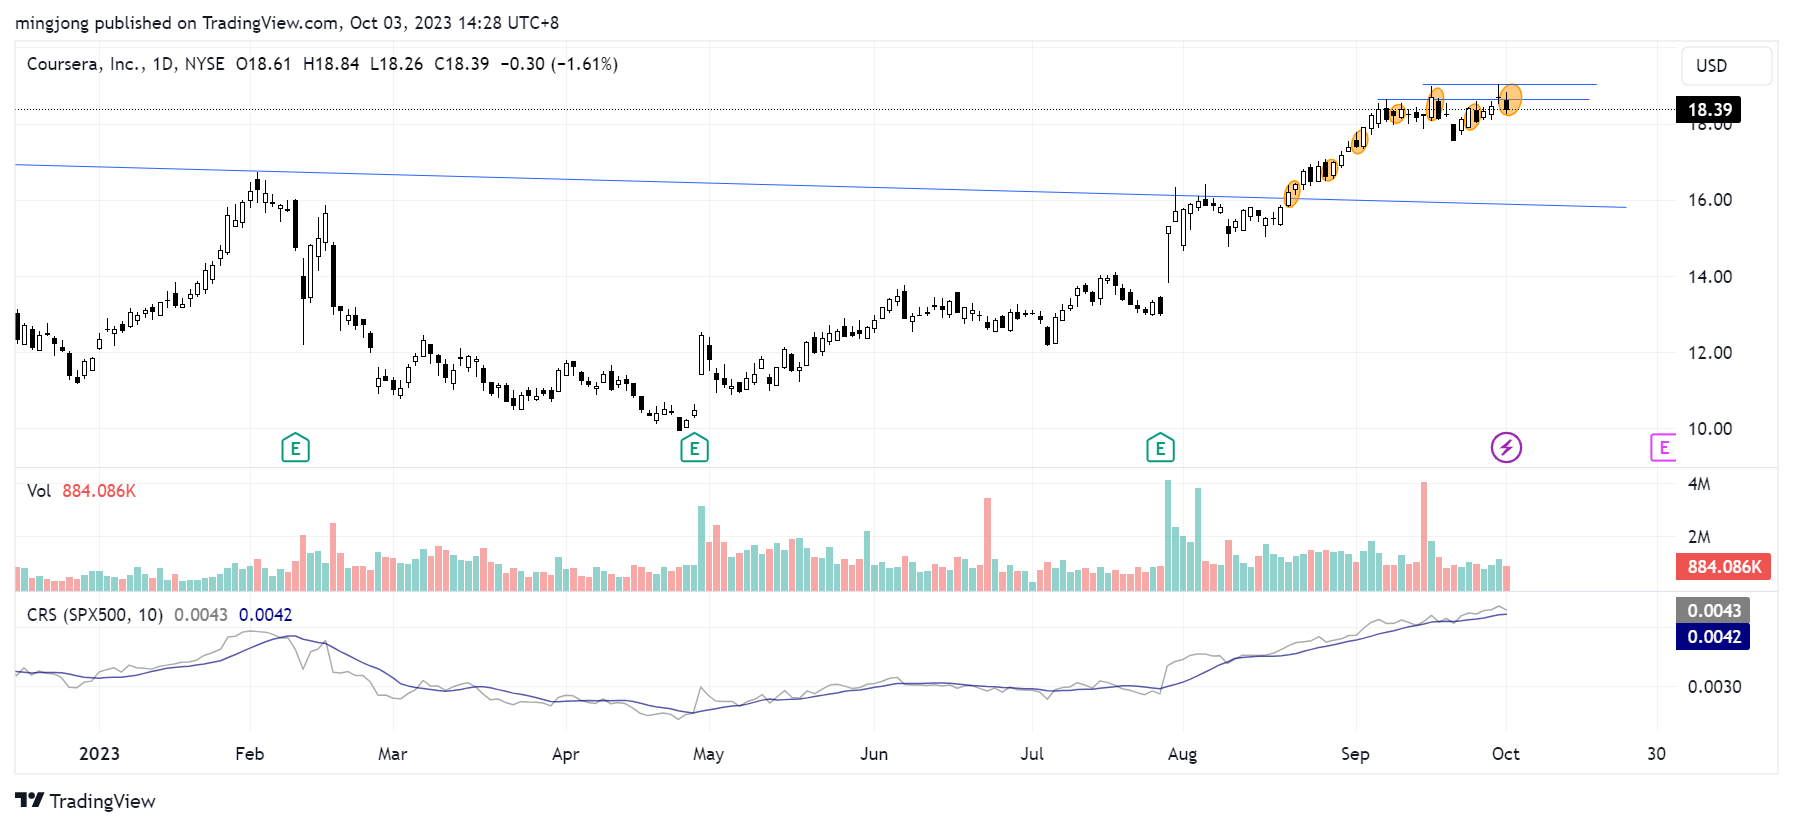
5 “low hanging fruits” (META, AKAM, etc…) trade entries setup + 18 others (EDU, COUR, etc…) plus 25 “wait and hold” candidates have been discussed during the live session.
Author

Ming Jong Tey
Independent Analyst
Ming Jong Tey has been trading since 2008. He started his learning journey from technical analysis (indicators, Fibonacci, etc...) to value investing. Throughout his journey, he develops an interest in price action with chart pattern trading.


