|

NZD/USD turns south during Powell’s testimony

  • The NZD/USD reversed its course during the American session, falling from a high of 0.6222 to 0.6180.
  • The US reported mixed mid-tier data.
  • Chair Powell’s hawkish remarks during his second-day testimony before the US Congress boosted US yields.

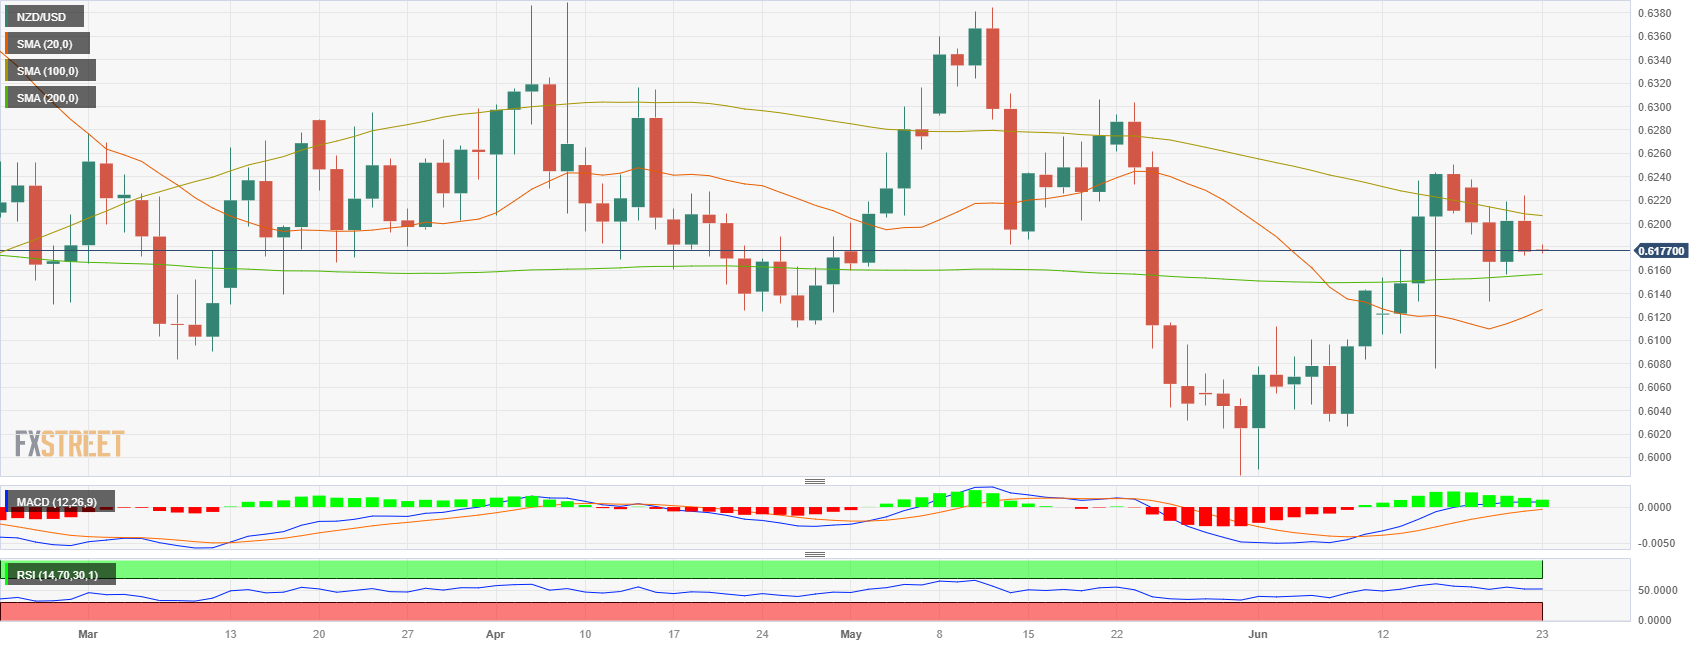
On Thursday, the NZD/USD cleared daily gains, which saw the pair jumping to a daily high of 0.6222 past the 100-day Simple Moving Average (SMA). However. it failed to consolidate above it and retreated to 0.6180. In that sense, hawkish remarks by Jerome Powell during his testimony before the US Senate fueled US bond yields and helped the Greenback gain traction. On the New Zealand side, no relevant reports will be released on Friday.

Investors bet on higher rate hikes by the Fed following Chair Powell’s testimony

In his appearance before the US Senate's Banking, House, and Urban Affairs Committee, Powell reiterated that the central bank has a considerable distance to cover. He provided reassurance that monetary policy remains effective in its efforts to combat inflation. Chair Powell also confirmed that the Federal Open Market Committee (FOMC) generally believes that raising rates once more this year and potentially twice more would be appropriate. As a reaction, the 2-year bond yield jumped to its highest level since March to 4.8% and gave further traction to the USD. 

On the other hand, the US Bureau of Census Analysis revealed 260K Jobless Claims for the week ending June 16, slightly exceeding the expected 262,000. Additionally, the Chicago Fed National Activity index dropped to -0.15 in May vs the consensus of 0, and Existing Home Sales reached 4.3M, surpassing the consensus estimate of 4.25M, indicating resilience in the housing sector.

Attention now turns to the release of the S&P Global PMIs on Friday, where investors will get a clear outlook regarding the US economy’s health.

NZD/USD Levels to watch

According to the daily chart, the NZD/USD holds a neutral outlook for the short term as indicators have turned flat but slightly tilted to the downside. In addition, the 20-,100- and 200-day Simple Moving Averages are converging towards the 0.6150 levels and potential bullish or bearish crosses may determine the short-term trajectory.

On the downside, support levels line up at the 200- and 20-day SMAs at 0.6153 and 0.6118 respectively, followed then by the 0.6100 area. On the upside, the 100-day SMA at 0.6205, the daily high at 0.6222 and the 0.6250 area stand as short-term resistances.
NZD/USD

Overview
Today last price0.6178
Today Daily Change-0.0024
Today Daily Change %-0.39
Today daily open0.6202
 
Trends
Daily SMA200.6114
Daily SMA500.6177
Daily SMA1000.621
Daily SMA2000.6154
 
Levels
Previous Daily High0.6219
Previous Daily Low0.6156
Previous Weekly High0.625
Previous Weekly Low0.6076
Previous Monthly High0.6385
Previous Monthly Low0.5985
Daily Fibonacci 38.2%0.6195
Daily Fibonacci 61.8%0.618
Daily Pivot Point S10.6166
Daily Pivot Point S20.6129
Daily Pivot Point S30.6103
Daily Pivot Point R10.6229
Daily Pivot Point R20.6255
Daily Pivot Point R30.6292

Author

Patricio Martín

Patricio is an economist from Argentina passionate about global finance and understanding the daily movements of the markets.


More from Patricio Martín
Share:

Editor's Picks

AUD/USD recovers toward 0.7000 amid improving mood

AUD/USD is firming up toward 0.7000 in Asia on Tuesday, helped by improving market mood. A pause in the US Dollar rebound also aids the pair's upside. However, geopolitical risks and caution ahead of AI tech earnings report could limit the pair.

USD/JPY flatlines near 158.50 as markets seek direction

USD/JPY steadies around 158.50 in the Asian trading hours on Tuesday. Traders prefer to wait on the sidelines ahead of Japan’s National Consumer Price Index inflation data later on Friday. Meanwhile, elevated US bond yields provide some support to the US Dollar against the Japanese Yen.

Gold slides amid recovery in bond yields, higher oil prices

Gold price declines to near $4,120 in the early European trade. The precious metal faces selling pressure amid a recovery in yields on United States bonds and rising oil prices. US Treasury Yields have shown signs of recovery, with US hyperscalers set to report their Q3 earnings in near time. As of writing, 10-year US Treasury Yields are down 0.35% to near 5.13%

Ripple and Cardano face downside risk as Solana consolidates
Top altcoins, including Ripple (XRP), Cardano (ADA), and Solana (SOL), stall on Tuesday after a bearish week, suggesting a brief pause in selling pressure. The technical outlook for XRP and ADA indicates a downside bias, while SOL shows mixed signals, with the price holding above $100 as momentum eases. Ripple trades at $1.2974 at press time on Tuesday, keeping a bearish near-term tone.
Markets now see no hike in October, but inflation is still a major concern

US inflation has returned to the spotlight after the latest Consumer Price Index (CPI) and Producer Price Index (PPI) reports showed a significant acceleration in price pressures. The data raised concerns that the Federal Reserve may need to maintain restrictive monetary policy for longer, pushing interest-rate expectations higher and putting pressure on stocks and gold.

The US Dollar fell. Gold didn't rally. That tells you everything
Gold (XAU/USD) is struggling to capitalize on a weaker US Dollar (USD), after repeatedly failing to establish itself above the $4,200 level. The precious metal remains confined to a relatively narrow trading range despite a combination of developments that would normally support higher prices.