NZD/USD Technical Analysis: Continuing rough channel lower amidst frequent upswings
- The Kiwi is seeing another intraday cyclical rebound from lows near 0.6750 in a repeat of Monday's market action that saw the NZD/USD lurch to 0.6815 before bedding back down as broader market action saw overall flows push out of and then back into the US Dollar.

NZD/USD Chart, 5-Minute
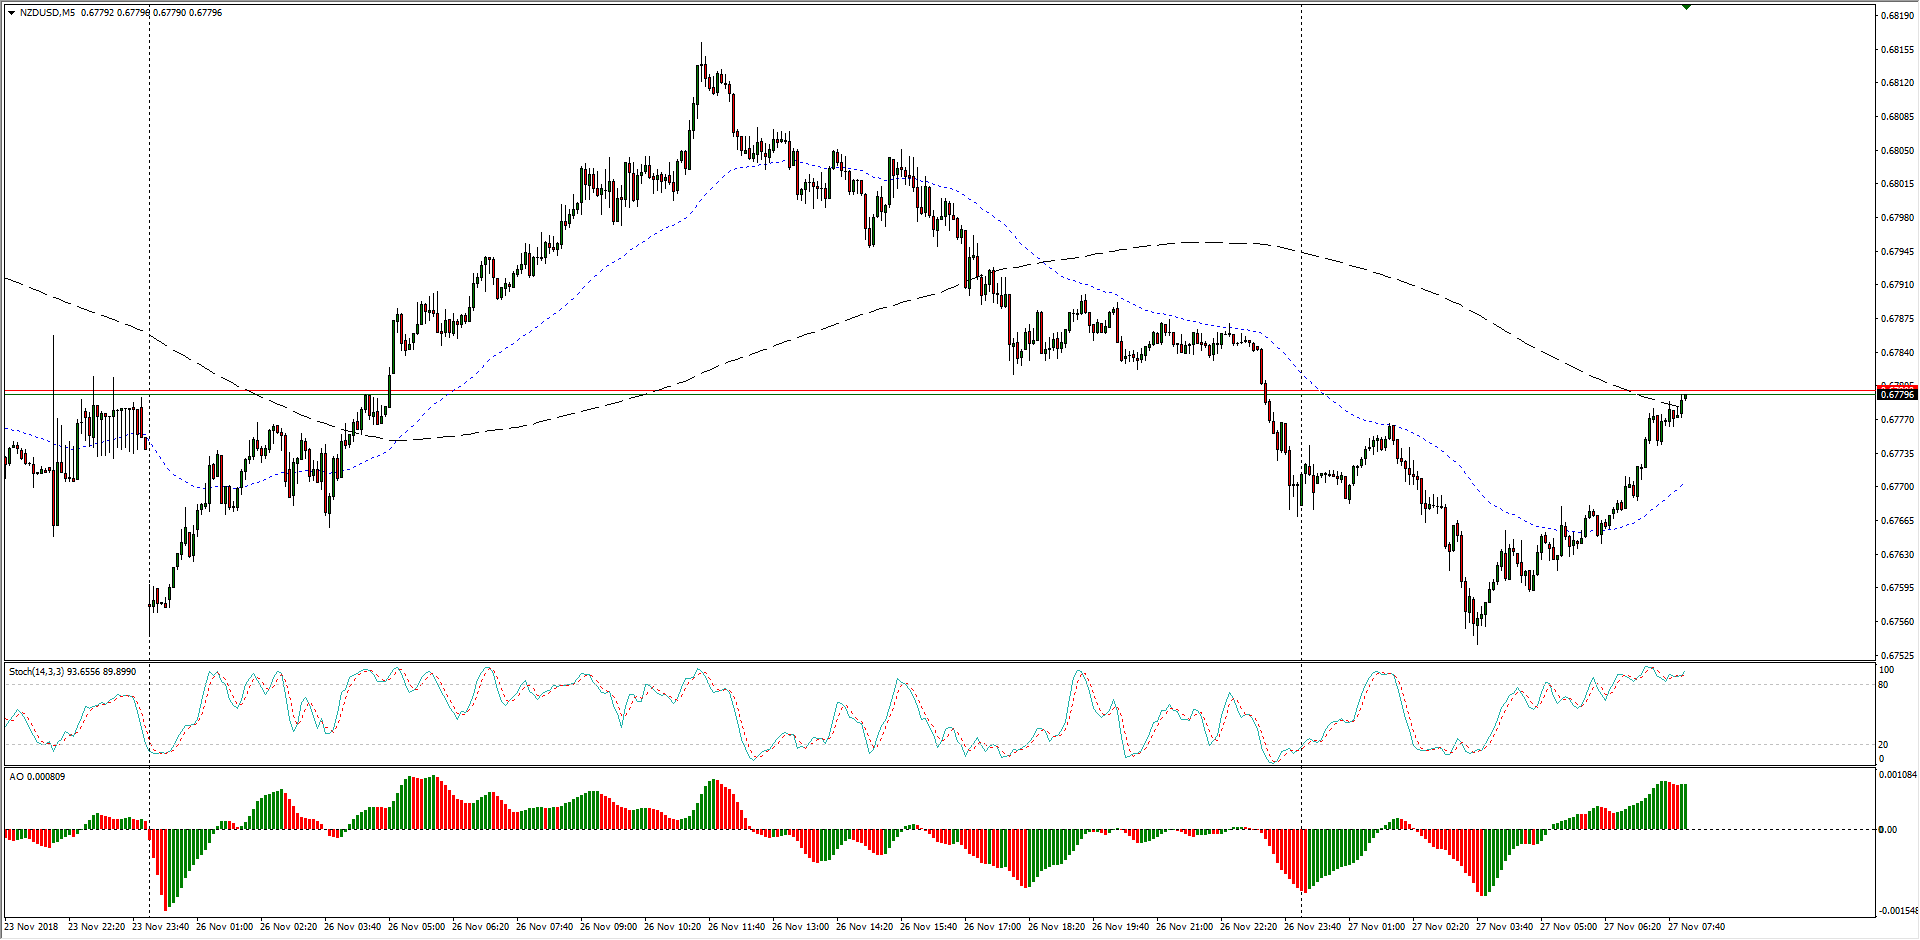
- The past two weeks shows the Kiwi steadily cycling lower in large swings, marking out a rough channel that threatens to lose momentum from a lateral swing low at the 0.6750 level.
NZD/USD Chart, 30-Minute
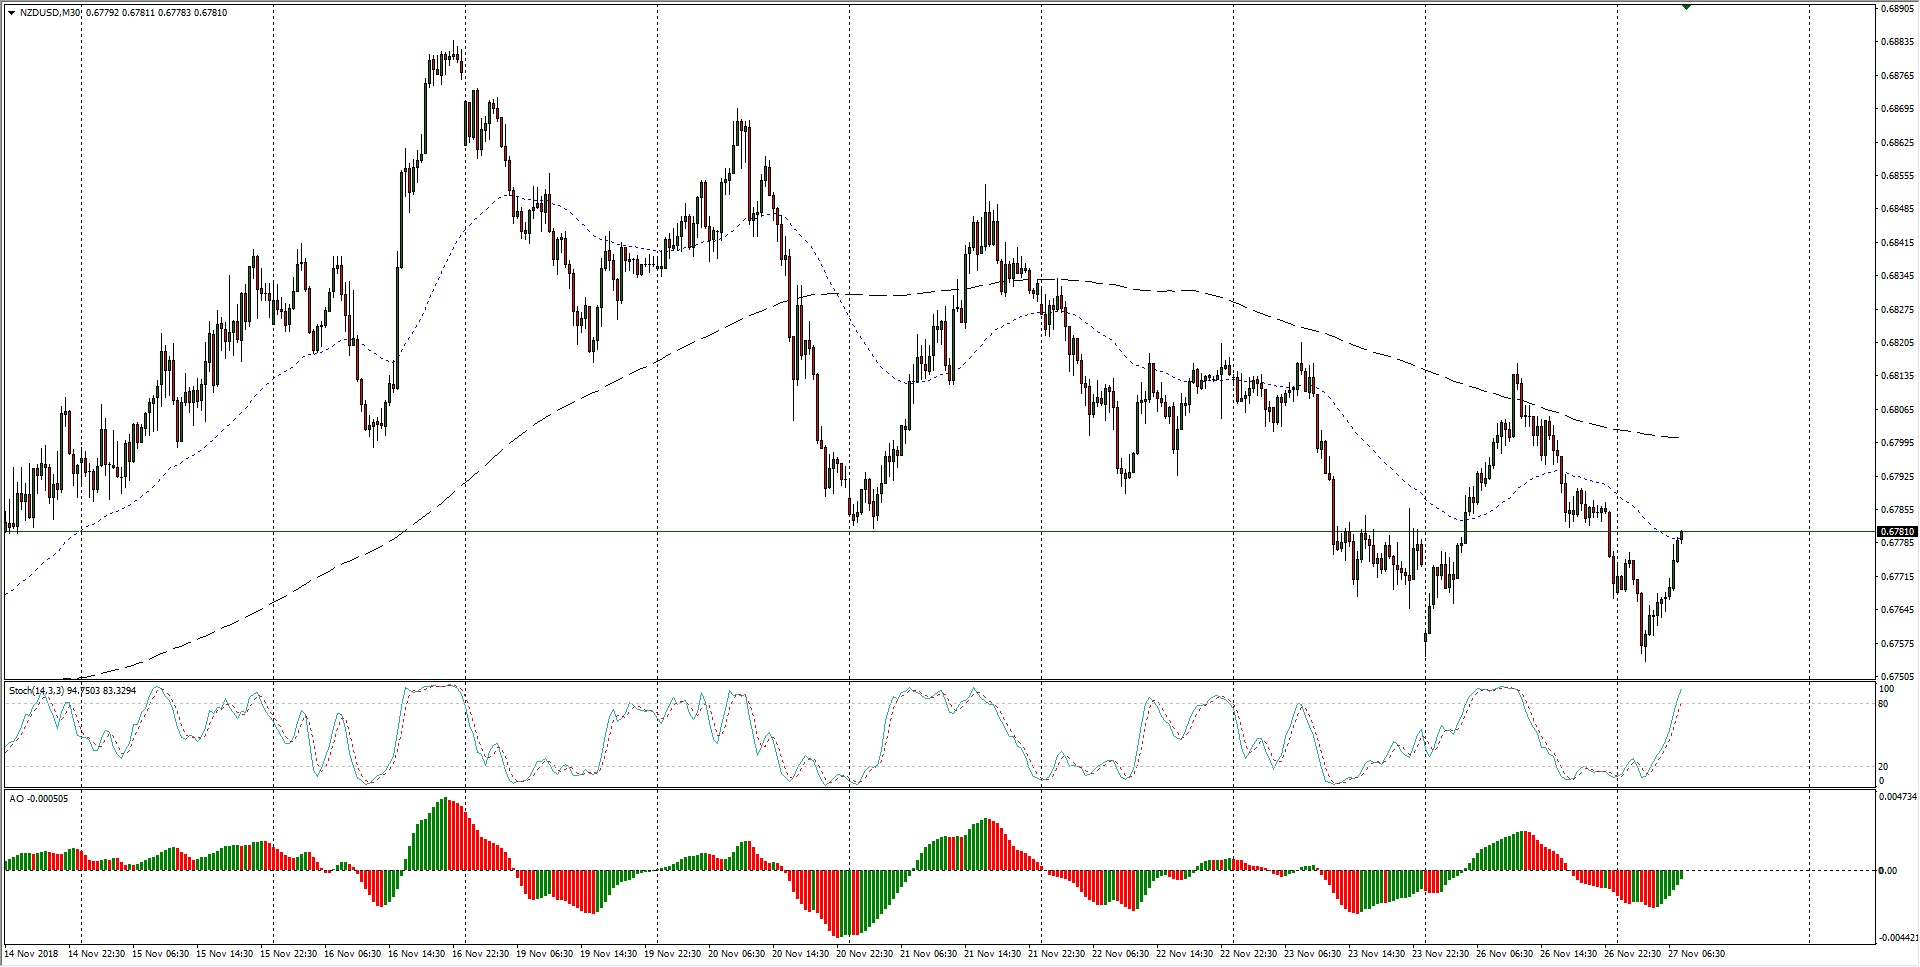
- The past two months have seen the NZD/USD pair recover from medium-term lows at the 0.6440 level, but the last move towards the upside appears to have run out of momentum as the Kiwi becomes entangled in the 50-period moving average at the 0.6800 handle.
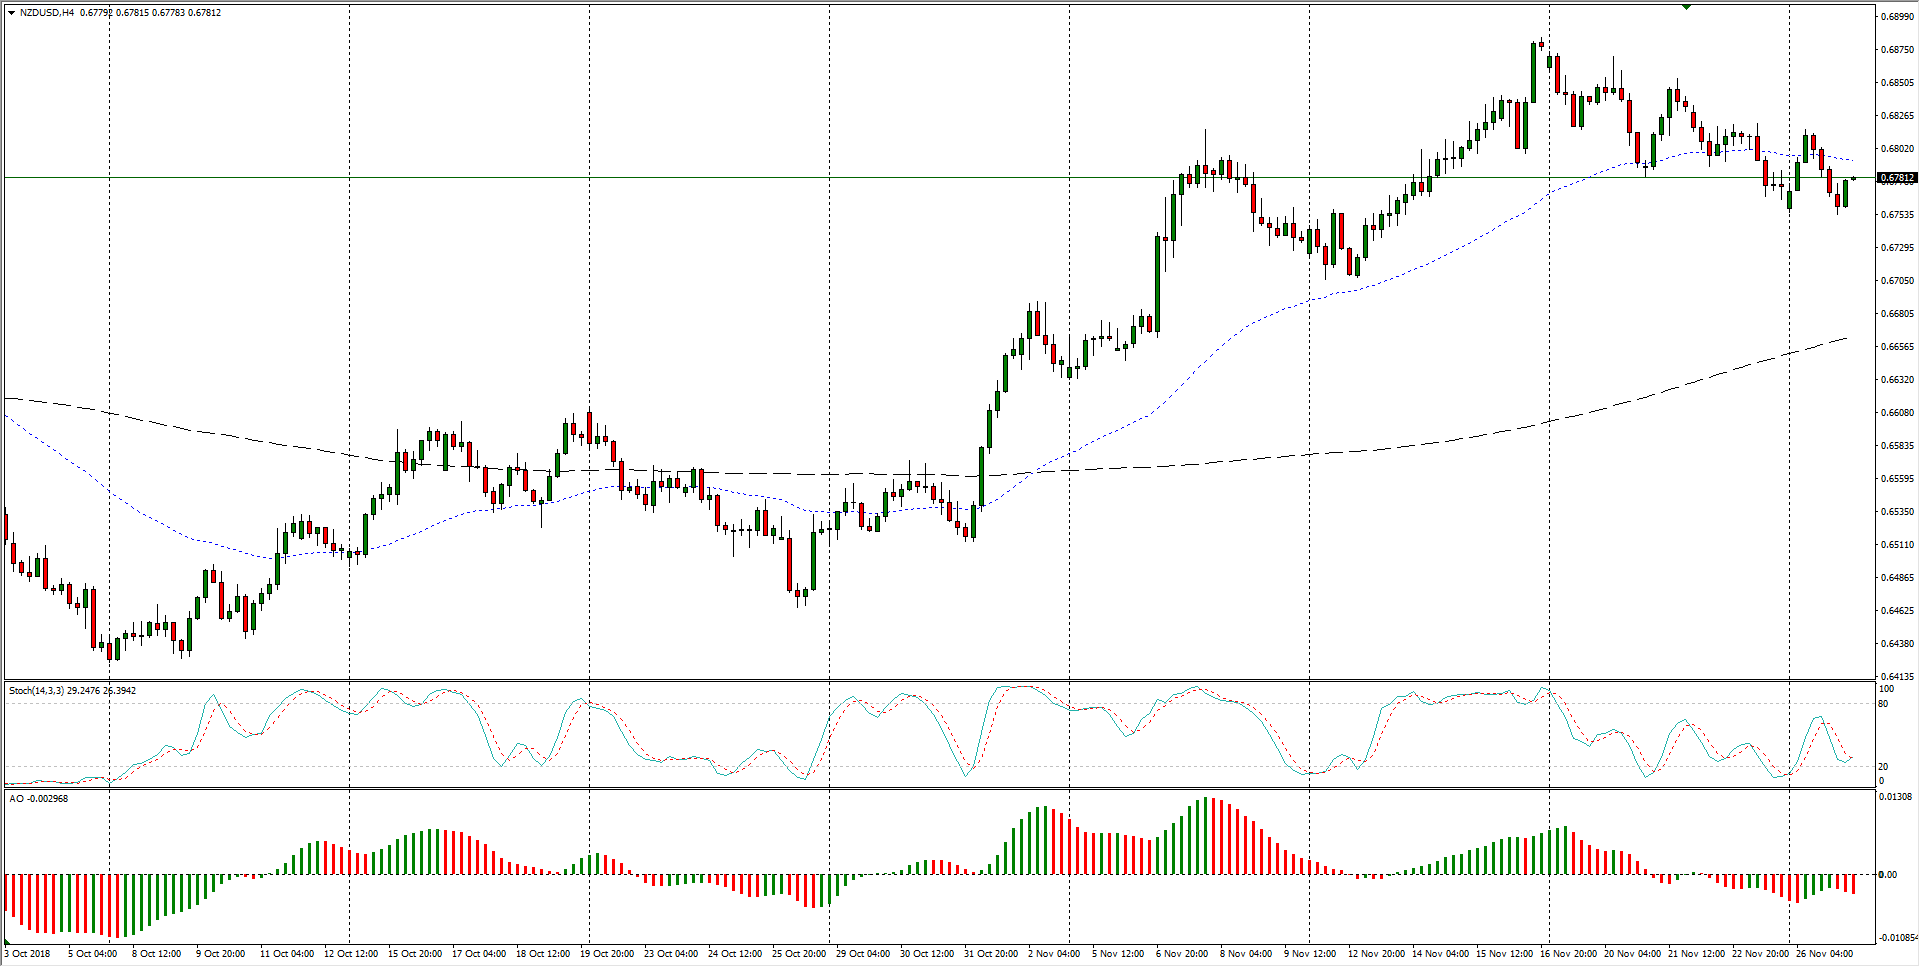
NZD/USD, 4-Hour
NZD/USD
Overview:
Today Last Price: 0.6778
Today Daily change: -7.0 pips
Today Daily change %: -0.103%
Today Daily Open: 0.6785
Trends:
Previous Daily SMA20: 0.674
Previous Daily SMA50: 0.6632
Previous Daily SMA100: 0.6659
Previous Daily SMA200: 0.6877
Levels:
Previous Daily High: 0.6818
Previous Daily Low: 0.6756
Previous Weekly High: 0.6876
Previous Weekly Low: 0.6767
Previous Monthly High: 0.663
Previous Monthly Low: 0.6424
Previous Daily Fibonacci 38.2%: 0.6779
Previous Daily Fibonacci 61.8%: 0.6794
Previous Daily Pivot Point S1: 0.6755
Previous Daily Pivot Point S2: 0.6724
Previous Daily Pivot Point S3: 0.6693
Previous Daily Pivot Point R1: 0.6816
Previous Daily Pivot Point R2: 0.6848
Previous Daily Pivot Point R3: 0.6878
Author

Joshua Gibson
FXStreet
Joshua joins the FXStreet team as an Economics and Finance double major from Vancouver Island University with twelve years' experience as an independent trader focusing on technical analysis.


