|

NZD/USD technical analysis: Break of 0.6570 confirms short-term falling wedge on H1 chart

  • Falling wedge formation favors the pair rise towards 0.6615 on the confirmation.
  • Current month lows limit the downside with near oversold RSI levels.

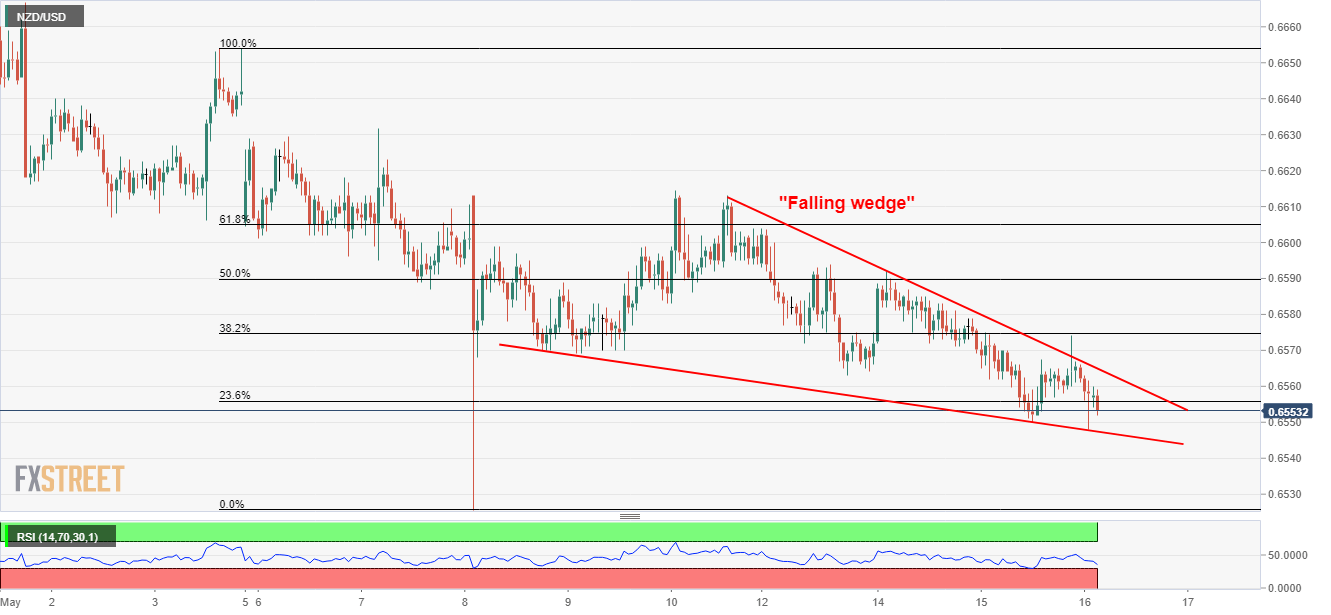
NZD/USD maintains a weeklong “falling wedge” technical formation as it trades near 0.6555 during early Thursday.

Even if the Antipodeans are under pressure due to fundamentals, near oversold levels of 14-bar relative strength index (RSI) and support-line of aforementioned bullish chart pattern can question the pair’s further declines at 0.6545.

In a case where the quote slips beneath 0.6545, the current month lows near 0.6525, 0.6500 and October 2018 low near 0.6425 could gain bears’ attention.

Meanwhile, an upside clearance of 0.6570 can confirm the bullish technical pattern and propel prices towards May 10 tops surrounding 0.6610/15.

Also, the pair’s successful rise past-0.6615 can recall 0.6665 and 0.6685 back on the chart.

NZD/USD hourly chart

Trend: Pullback expected

Additional important levels

Overview
Today last price0.6554
Today Daily Change-9 pips
Today Daily Change %-0.14%
Today daily open0.6563
 
Trends
Daily SMA200.6624
Daily SMA500.6732
Daily SMA1000.6765
Daily SMA2000.6717
Levels
Previous Daily High0.6579
Previous Daily Low0.655
Previous Weekly High0.6632
Previous Weekly Low0.6526
Previous Monthly High0.6838
Previous Monthly Low0.658
Daily Fibonacci 38.2%0.6561
Daily Fibonacci 61.8%0.6568
Daily Pivot Point S10.6549
Daily Pivot Point S20.6535
Daily Pivot Point S30.652
Daily Pivot Point R10.6578
Daily Pivot Point R20.6593
Daily Pivot Point R30.6607

Author

Anil Panchal

Anil Panchal

FXStreet

Anil Panchal has nearly 15 years of experience in tracking financial markets. With a keen interest in macroeconomics, Anil aptly tracks global news/updates and stays well-informed about the global financial moves and their implications.

More from Anil Panchal
Share:

Editor's Picks

EUR/USD challenges 1.1800, two-week lows

EUR/USD remains on the defensive, extending its leg lower to the vicinity of the 1.1800 region, or two-week lows, on Tuesday. The move lower comes as the US Dollar gathers further traction ahead of key US data releases, inclusing the FOMC Minutes, on Wednesday.

GBP/USD looks weaker near 1.3500

GBP/USD adds to Monday’s pessimism and puts the 1.3500 support to the test on Tuesday. Cable’s marked pullback comes in response to extra gains in the Greenback while disappointing UK jobs data also collaborate with the offered bias around the British Pound.

Gold loses further momentum, approaches $4,800

Gold recedes to fresh two-week troughs around the $4,800 region per troy ounce on Tuesday. The precious metal builds on Monday’s downtick following a marked rebound in the US Dollar and mixed US Treasury yields across the board.

Crypto Today: Bitcoin, Ethereum, XRP upside looks limited amid deteriorating retail demand

The cryptocurrency market extends weakness with major coins including Bitcoin (BTC), Ethereum (ETH) and Ripple (XRP) trading in sideways price action at the time of writing on Tuesday.

UK jobs market weakens, bolstering rate cut hopes

In the UK, the latest jobs report made for difficult reading. Nonetheless, this represents yet another reminder for the Bank of England that they need to act swiftly given the collapse in inflation expected over the coming months. 

Ripple slides to $1.45 as downside risks surge

Ripple edges lower at the time of writing on Tuesday, from the daily open of $1.48, as headwinds persist across the crypto market. A short-term support is emerging at $1.45, but a buildup of bearish positions could further weaken the derivatives market and prolong the correction.