NZD/USD technical analysis: 21-HMA, 10-day long resistance-line limit latest recovery
- Near-term strong resistances question recent pullback.
- Current year low acts as strong downside support.

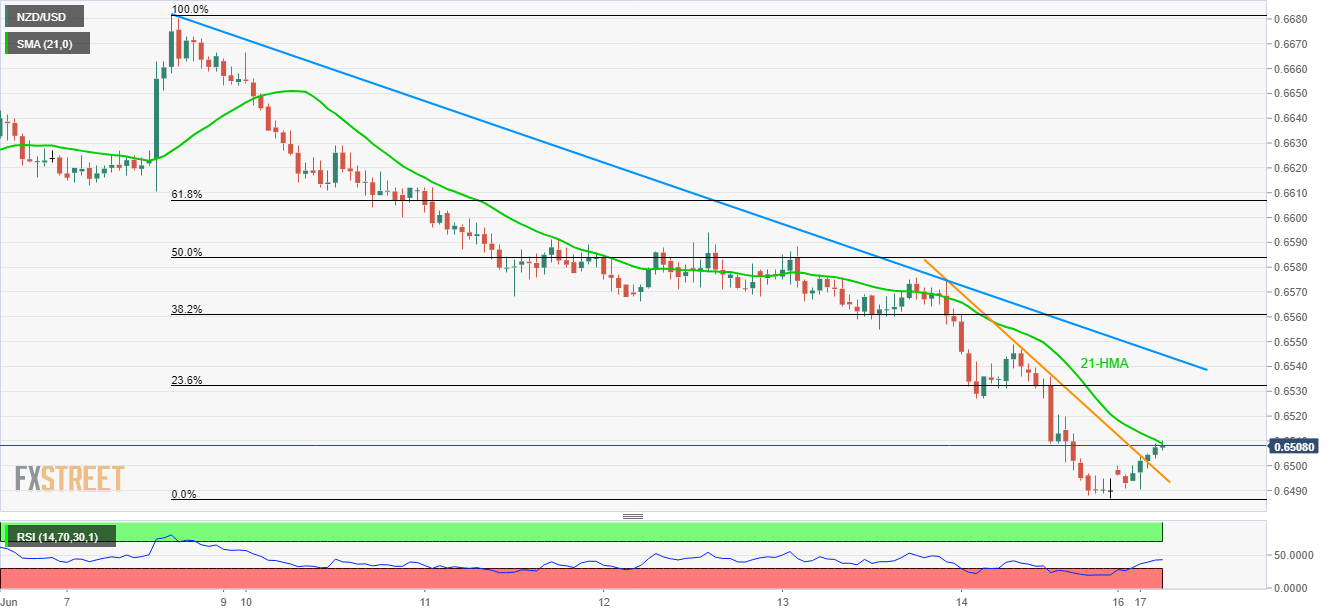
The NZD/USD pair is yet to cross near-term important resistances in order to justify the latest recovery as it trades near 0.6510 during early Monday.
A 21-hour moving average (21-HMA) can be considered as the closest resistance at 0.6510, a break of which can further escalate the pullback towards 10-day long descending trend-line at 0.6545.
Though, pair’s successful break of 0.6545 enables it to challenge 0.6580 and 0.6600 during further upside.
Meanwhile, 0.6500 and May month low around 0.6480 can limit the pair’s near-term declines.
Should there be additional weakness past-0.6480, October 2018 bottom around 0.6460 and the year 2018 low near 0.6425/30 can please sellers.
NZD/USD hourly chart
Trend: Bearish
Author

Anil Panchal
FXStreet
Anil Panchal has nearly 15 years of experience in tracking financial markets. With a keen interest in macroeconomics, Anil aptly tracks global news/updates and stays well-informed about the global financial moves and their implications.


