NZD/USD stays firm amidst mixed US economic data, sparks recession concerns
- NZD/USD is firm after the release of mixed US economic data.
- US Q1 2023 GDP grows but misses estimates, while unemployment claims fell to 230K, below forecasts.
- NZD/USD faces the threat of reaching the YTD low at 0.6084 if support at 0.6100 is breached, though upside risks remain.

NZD/USD advances in the North American session after hitting a daily low of 0.6114 though recession fears sparked by US economic data augmented appetite for the US Dollar (USD). The NZD/USD is trading at 0.6131, down by a minuscule 0.09%.
NZD/USD climbs even though the US Dollar rises
Wall Street is not reflecting a dampened economic outlook in the United States (US). However, in the FX space, the antipodeans are erasing previous losses after the US Department of Commerce revealed the Advanced Gross Domestic Product (GDP) for Q1 in 2023 rose by 1.1% QoQ, below estimates of 2%, and trailed 2022 last quarter at 2.6%. Delving into the report, the US Core Personal Consumption Expenditure (PCE) rose by 4.9% QoQ vs. estimates of 4.8%. That would keep the US Federal Reserve (Fed) tightening monetary policy as inflation continues to edge h
Meanwhile, the US Department of Labor revealed that Initial Jobless Claims snapped three straight weeks of beating estimates, rose by 230K for the week ending April 22, less than forecasts of 248K.
After the data release, the NZD/USD seesawed between the day’s high and 0.6130 before dropping toward the 0.6120 area. Then, the pair recovered some ground and is sitting at around 0.6130s. The US Dollar Index, a measure of the buck’s value vs. a basket of peers, rises 0.20%, at 101.650.
US Treasury bond yields advanced as data justified Fed’s May rate hikes. Odds for a 25 bps interest rate increase for the May meeting climbed to 84.8%, higher than April 26 at 72.2%, according to the CME Fed WatchTool.
On the New Zealand front, April’s ANZ Activity and Business Confidence report showed mixed readings, with the former improving. However, it remained in negative territory, while the latter plummeted below the prior’s reading.
NZD/USD Technical Analysis
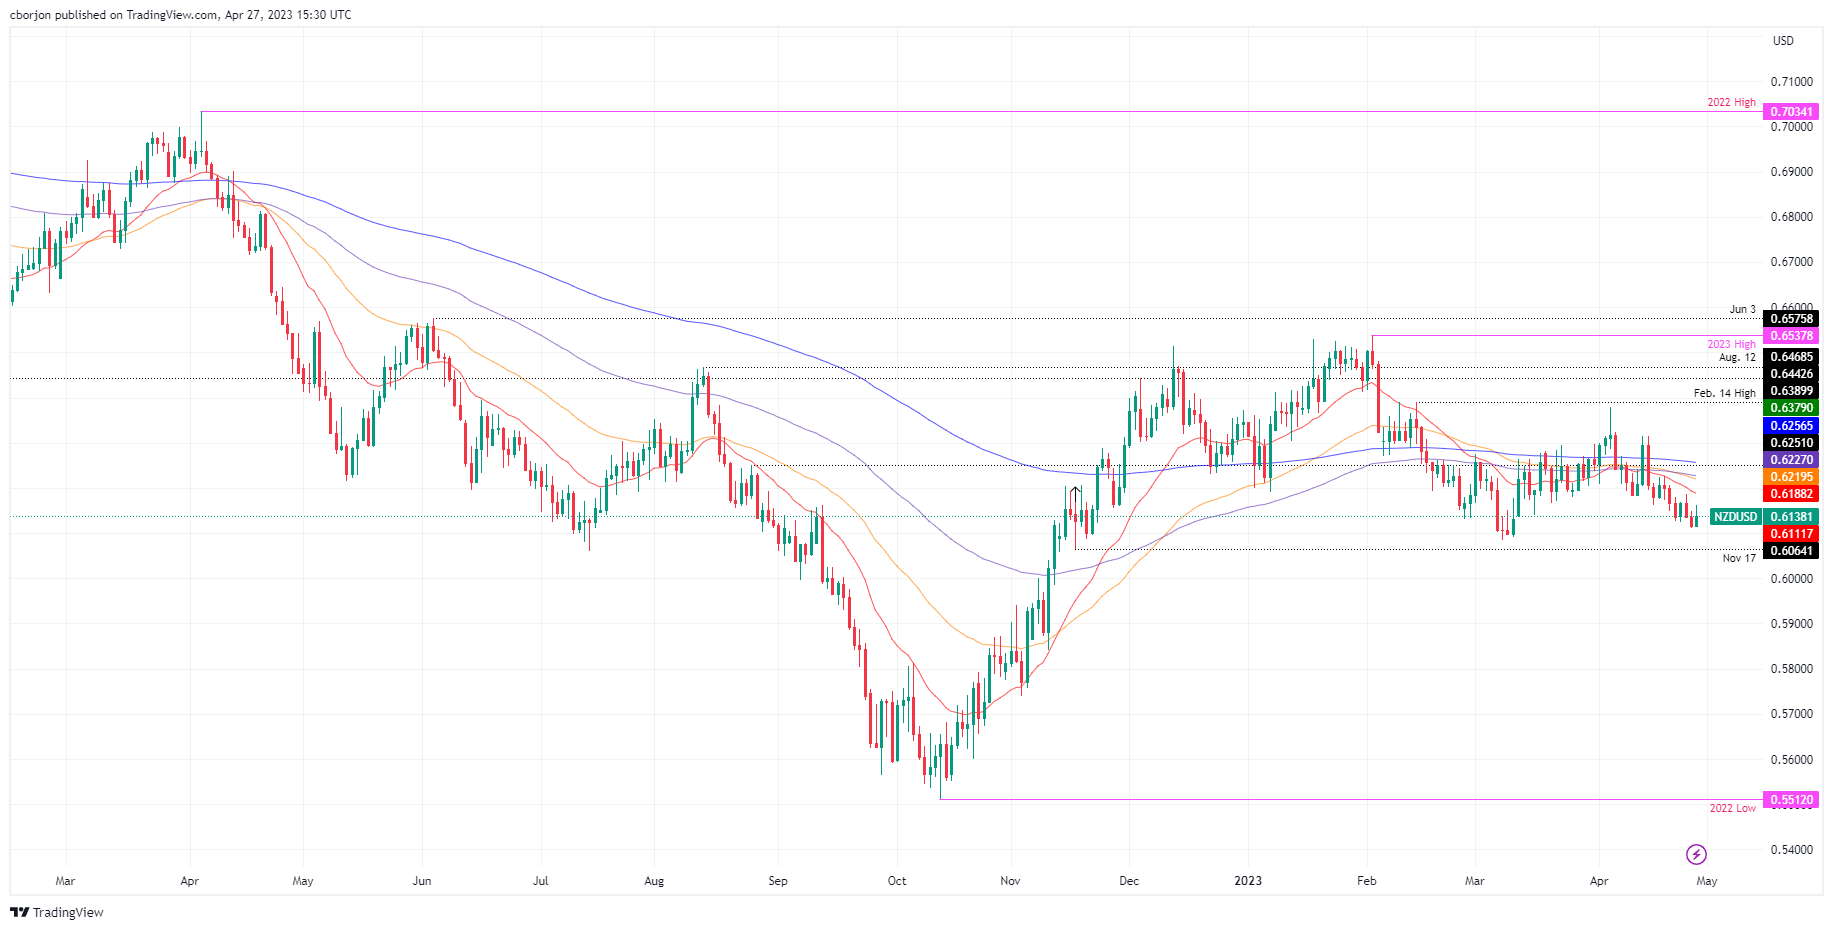
After bottoming around 0.6114 nearby the weekly low, the NZD/USD snapped two days of losses and bounced toward the 0.6130s area. Nevertheless, the top wick of today’s candlestick suggests that sellers are in control. If NZD/USD buyers want to get in control, they must reclaim the 20-day Exponential Moving Average (EMA) At 0.6188. Once broken, they could pose a threat toward 0.6200. Conversely, the NZD/USD first support would be 0.6100. A breach of the latter will expose the YTD low at 0.6084.
Author

Christian Borjon Valencia
FXStreet
Markets analyst, news editor, and trading instructor with over 14 years of experience across FX, commodities, US equity indices, and global macro markets.

















