NZD/USD Price Forecast: Tests two-year lows after breaking below 0.5800
- NZD/USD tests its two-year low at 0.5772, a level last seen in November 2023.
- An upward correction could be triggered once the 14-day RSI drops below the 30 mark.
- The nine-day EMA at 0.5839 appears as the primary resistance level.

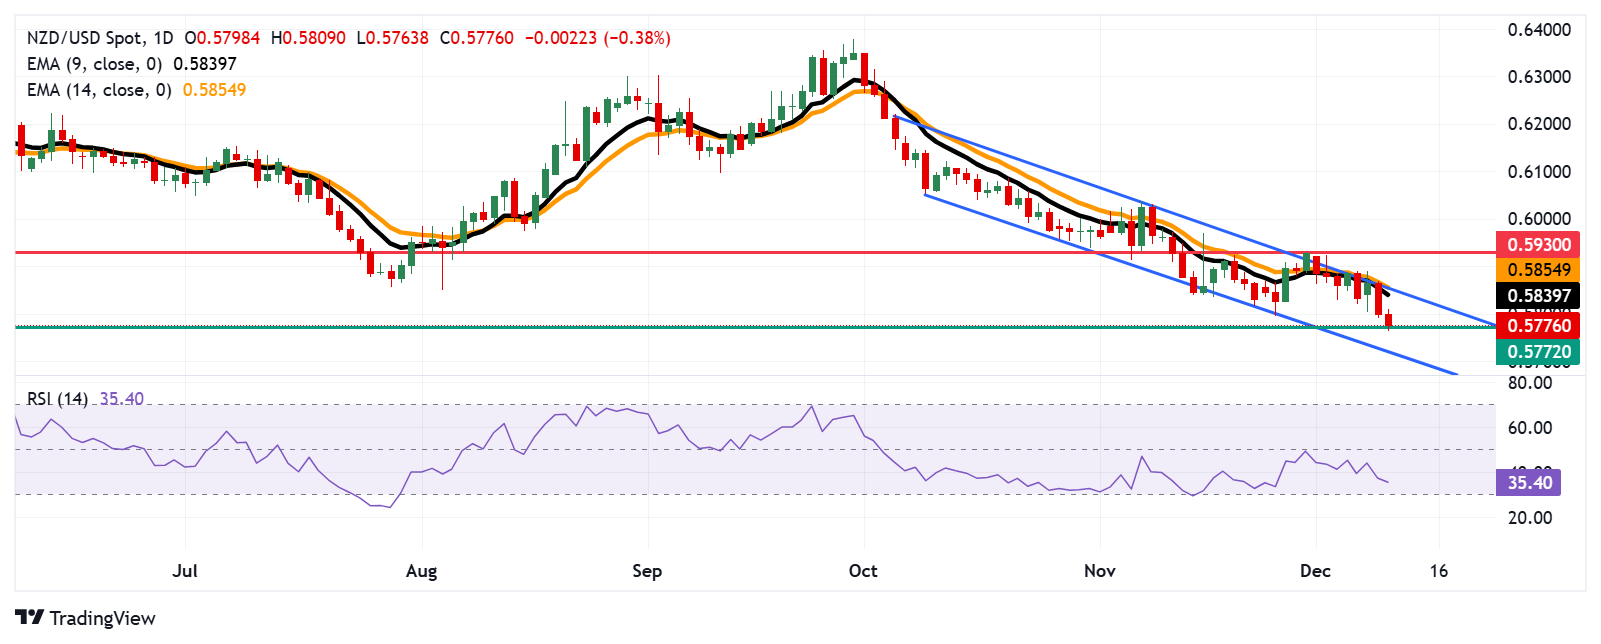
The NZD/USD pair extends its gains for the second successive day, trading around 0.5780 during the European session on Wednesday. Technical analysis of the daily chart suggests a strengthening bearish bias as the pair is confined within a descending channel pattern.
Additionally, the NZD/USD pair remains trading below the nine- and 14-day Exponential Moving Averages (EMAs), signaling weak short-term price momentum. Furthermore, the 14-day Relative Strength Index (RSI) falls toward the 30 level, reflecting a predominantly bearish sentiment. A drop below the 30 level would indicate an oversold condition, potentially triggering an upward correction.
The immediate support for NZD/USD lies at the two-year low of 0.5772 level, last seen in November 2023. A break below this level could strengthen the bearish sentiment and push the pair to approach the lower boundary of the descending channel at 0.5720 level.
On the upside, NZD/USD may find initial resistance at the nine-day EMA at 0.5839 level, followed by the descending channel’s upper boundary at 0.5850 level. A break above this channel would weaken the bearish bias and support the pair to explore the region around its four-week high of 0.5930 level.
NZD/USD: Daily Chart
New Zealand Dollar PRICE Today
The table below shows the percentage change of New Zealand Dollar (NZD) against listed major currencies today. New Zealand Dollar was the weakest against the Japanese Yen.
| USD | EUR | GBP | JPY | CAD | AUD | NZD | CHF | |
|---|---|---|---|---|---|---|---|---|
| USD | 0.23% | 0.21% | -0.15% | 0.08% | 0.34% | 0.40% | 0.16% | |
| EUR | -0.23% | -0.02% | -0.38% | -0.16% | 0.10% | 0.16% | -0.06% | |
| GBP | -0.21% | 0.02% | -0.39% | -0.14% | 0.12% | 0.18% | -0.05% | |
| JPY | 0.15% | 0.38% | 0.39% | 0.23% | 0.50% | 0.54% | 0.33% | |
| CAD | -0.08% | 0.16% | 0.14% | -0.23% | 0.26% | 0.32% | 0.09% | |
| AUD | -0.34% | -0.10% | -0.12% | -0.50% | -0.26% | 0.06% | -0.17% | |
| NZD | -0.40% | -0.16% | -0.18% | -0.54% | -0.32% | -0.06% | -0.23% | |
| CHF | -0.16% | 0.06% | 0.05% | -0.33% | -0.09% | 0.17% | 0.23% |
The heat map shows percentage changes of major currencies against each other. The base currency is picked from the left column, while the quote currency is picked from the top row. For example, if you pick the New Zealand Dollar from the left column and move along the horizontal line to the US Dollar, the percentage change displayed in the box will represent NZD (base)/USD (quote).
Author

Akhtar Faruqui
FXStreet
Akhtar Faruqui is a Forex Analyst based in New Delhi, India. With a keen eye for market trends and a passion for dissecting complex financial dynamics, he is dedicated to delivering accurate and insightful Forex news and analysis.


