NZD/USD Price Forecast: Tests nine-day EMA near 0.6000, channel's upper boundary
- NZD/USD may test the upper boundary of the descending channel pattern near 0.6000.
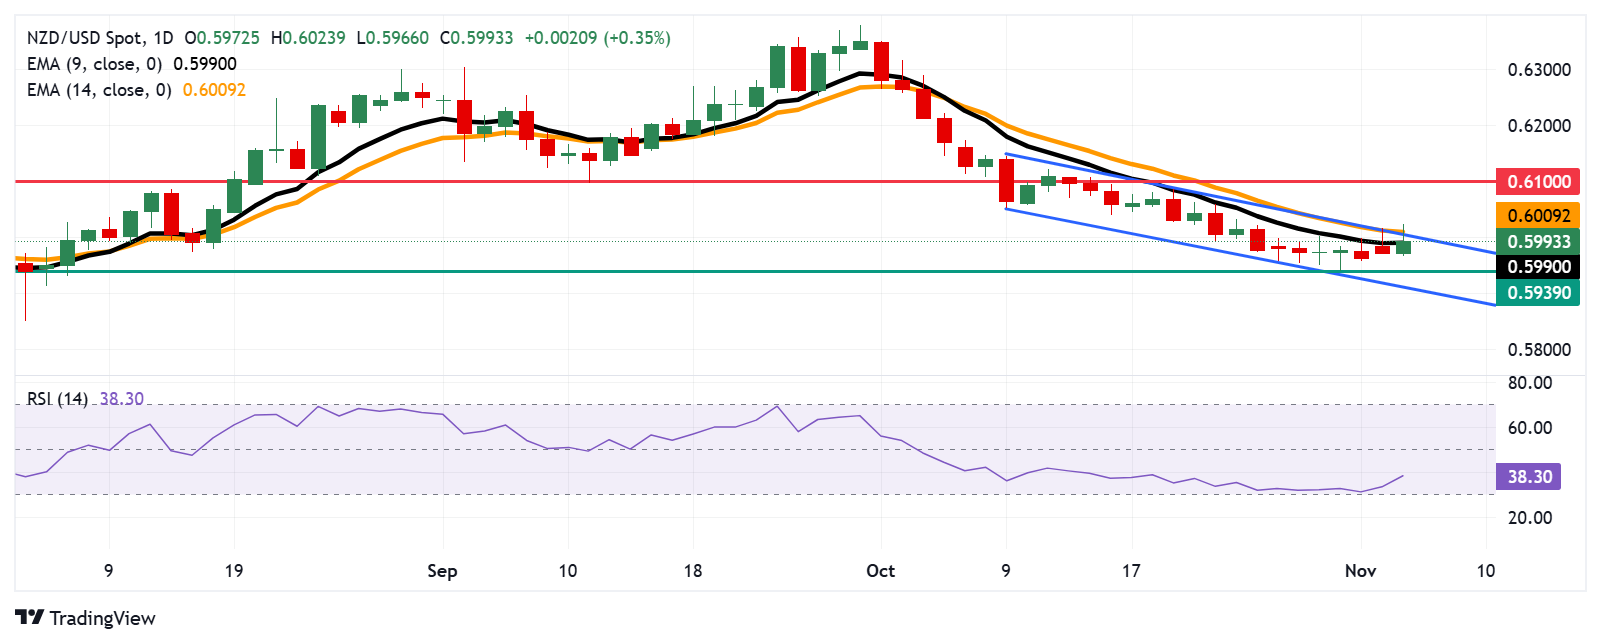
- The 14-day RSI offers confirmation of the ongoing bearish bias.
- The immediate support appears at a three-month low at 0.5939.

The NZD/USD pair halts its two days of losses, trading around 0.5990 during Tuesday's early European session. Daily chart analysis indicates a bearish bias, with the pair moving within a descending channel. The 14-day Relative Strength Index (RSI), a key momentum indicator, remains below the 50 level, confirming the ongoing bearish sentiment.
Adding to this outlook, the nine-day Exponential Moving Average (EMA) remains below the 14-day EMA, reinforcing bearish sentiment for the NZD/USD pair. Short-term momentum remains weak, suggesting sustained downward pressure.
On the downside, NZD/USD may find its support around a three-month low at the 0.5939 level. A break below this level could lead the pair to test the lower boundary of the descending channel near 0.5910, followed by the psychological level of 0.5900 level.
On the resistance side, the NZD/USD tests the nine-day EMA at 0.5990 level, followed by the upper boundary of the descending channel near the 14-day EMA at 0.6010 level. A breakthrough above this level could support the pair to explore the region around the psychological level of 0.6100.
NZD/USD: Daily Chart
New Zealand Dollar PRICE Today
The table below shows the percentage change of New Zealand Dollar (NZD) against listed major currencies today. New Zealand Dollar was the strongest against the Japanese Yen.
| USD | EUR | GBP | JPY | CAD | AUD | NZD | CHF | |
|---|---|---|---|---|---|---|---|---|
| USD | -0.11% | -0.18% | 0.06% | -0.09% | -0.38% | -0.35% | -0.04% | |
| EUR | 0.11% | -0.07% | 0.20% | 0.02% | -0.29% | -0.23% | 0.07% | |
| GBP | 0.18% | 0.07% | 0.24% | 0.07% | -0.22% | -0.17% | 0.14% | |
| JPY | -0.06% | -0.20% | -0.24% | -0.16% | -0.45% | -0.44% | -0.11% | |
| CAD | 0.09% | -0.02% | -0.07% | 0.16% | -0.29% | -0.26% | 0.05% | |
| AUD | 0.38% | 0.29% | 0.22% | 0.45% | 0.29% | 0.02% | 0.33% | |
| NZD | 0.35% | 0.23% | 0.17% | 0.44% | 0.26% | -0.02% | 0.30% | |
| CHF | 0.04% | -0.07% | -0.14% | 0.11% | -0.05% | -0.33% | -0.30% |
The heat map shows percentage changes of major currencies against each other. The base currency is picked from the left column, while the quote currency is picked from the top row. For example, if you pick the New Zealand Dollar from the left column and move along the horizontal line to the US Dollar, the percentage change displayed in the box will represent NZD (base)/USD (quote).
Author

Akhtar Faruqui
FXStreet
Akhtar Faruqui is a Forex Analyst based in New Delhi, India. With a keen eye for market trends and a passion for dissecting complex financial dynamics, he is dedicated to delivering accurate and insightful Forex news and analysis.


