NZD/USD Price Forecast: Steadies around 0.5740 as traders await a catalyst
- Kiwi trapped in tight 0.5700–0.5760 range with RSI signaling indecision between bulls and bears.
- Break above 0.5800 could trigger tests of 0.5843 and 0.5855 moving averages.
- A drop below 0.5700 risks renewed downside toward 0.5682 and year-to-date low at 0.5485.

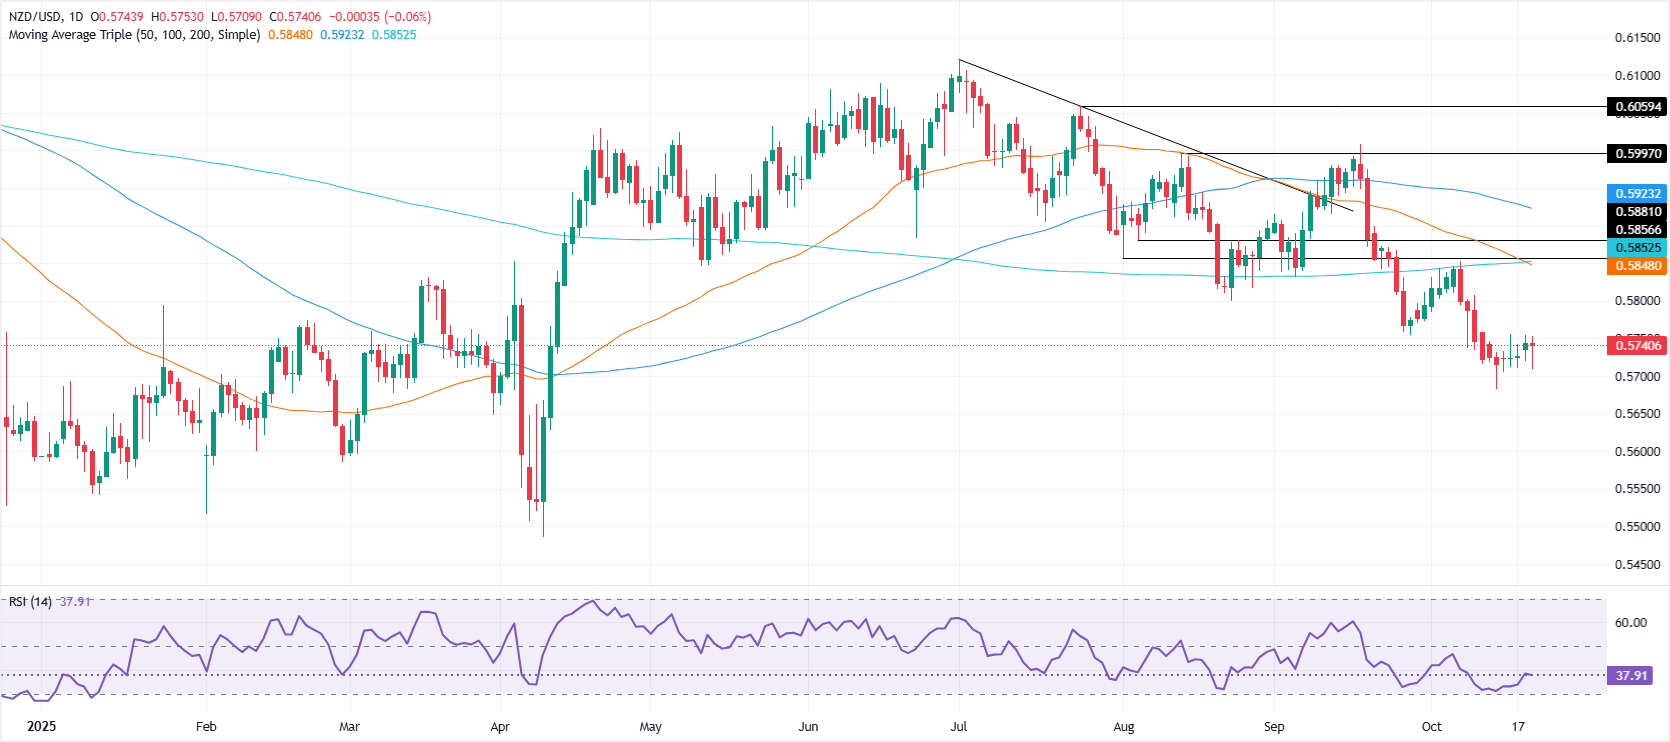
The New Zealand Dollar recovers some ground as Wednesday’s Asian session begins, yet it remains hoovering at around 0.5740 for the third straight day, below the 20-day Simple Moving Average (SMA).
NZD/USD Price Forecast: Technical outlook
The NZD/USD technical picture reveals the pair is consolidating at around 0.5700-0.5760. The Relative Strength Index (RSI) although bearish, it remains flatlined, an indication that neither buyers nor sellers are in control.
If NZD/USD clears the top of the range, this could pave the way for testing 0.5800. A breach of the latter will expose key resistance levels like the 50-day SMA at 0.5843 and the 200-day SMA at 0.5855.
Conversely, if the Kiwi tumbles below 0.5700, bears could target the latest cycle low seen at 0.5682 the October 14 low, ahead of challenging the year-to-date (YTD) bottom at 0.5485.
NZD/USD Price Chart – Daily
New Zealand Dollar Price This week
The table below shows the percentage change of New Zealand Dollar (NZD) against listed major currencies this week. New Zealand Dollar was the strongest against the Japanese Yen.
| USD | EUR | GBP | JPY | CAD | AUD | NZD | CHF | |
|---|---|---|---|---|---|---|---|---|
| USD | 0.57% | 0.47% | 0.91% | 0.02% | -0.01% | -0.09% | 0.58% | |
| EUR | -0.57% | -0.09% | 0.42% | -0.54% | -0.47% | -0.72% | 0.03% | |
| GBP | -0.47% | 0.09% | 0.28% | -0.45% | -0.38% | -0.62% | 0.10% | |
| JPY | -0.91% | -0.42% | -0.28% | -0.94% | -0.95% | -1.08% | -0.43% | |
| CAD | -0.02% | 0.54% | 0.45% | 0.94% | 0.01% | -0.18% | 0.56% | |
| AUD | 0.00% | 0.47% | 0.38% | 0.95% | -0.01% | -0.25% | 0.50% | |
| NZD | 0.09% | 0.72% | 0.62% | 1.08% | 0.18% | 0.25% | 0.73% | |
| CHF | -0.58% | -0.03% | -0.10% | 0.43% | -0.56% | -0.50% | -0.73% |
The heat map shows percentage changes of major currencies against each other. The base currency is picked from the left column, while the quote currency is picked from the top row. For example, if you pick the New Zealand Dollar from the left column and move along the horizontal line to the US Dollar, the percentage change displayed in the box will represent NZD (base)/USD (quote).
Author

Christian Borjon Valencia
FXStreet
Markets analyst, news editor, and trading instructor with over 14 years of experience across FX, commodities, US equity indices, and global macro markets.