NZD/USD Price Forecast: Sees more downside below 200-day EMA
- NZD/USD slumps to near 0.5870 as the US Dollar strengthens on a temporary truce between the US and China.
- The US and China have lowered tariffs by 115% for 90 days.
- RBNZ dovish bets limit the upside in the NZ Dollar.
The NZD/USD pair tumbles to near 0.5870 during North American trading hours on Monday. The Kiwi pair falls sharply as the demand for the US Dollar (USD) has increased after the comments from Washington signaled that the trade war between the United States (US) and China has been averted.
The US Dollar Index (DXY), which gauges the Greenback’s value against six major currencies, surges above 101.50, the highest level seen in a month. Market sentiment turns upbeat as the resolution of the trade war between the US and China is expected to uplift the global economic outlook. S&P 500 has posted substantial gains at open, demonstrating the strong risk appetite of investors.
In a joint statement, the US and China have announced a 90-day pause on tariffs and lowered them by 115%. The truce between the world’s two largest powerhouses is expected to diminish elevated US consumer inflation expectations.
Though the New Zealand Dollar (NZD) is down against the US Dollar, its outlook is improving as the US-China trade truce will have an indirect support for the Kiwi economy. Meanwhile, growing expectations that the Reserve Bank of New Zealand (RBNZ) will cut interest rates further could limit the NZD’s upside.
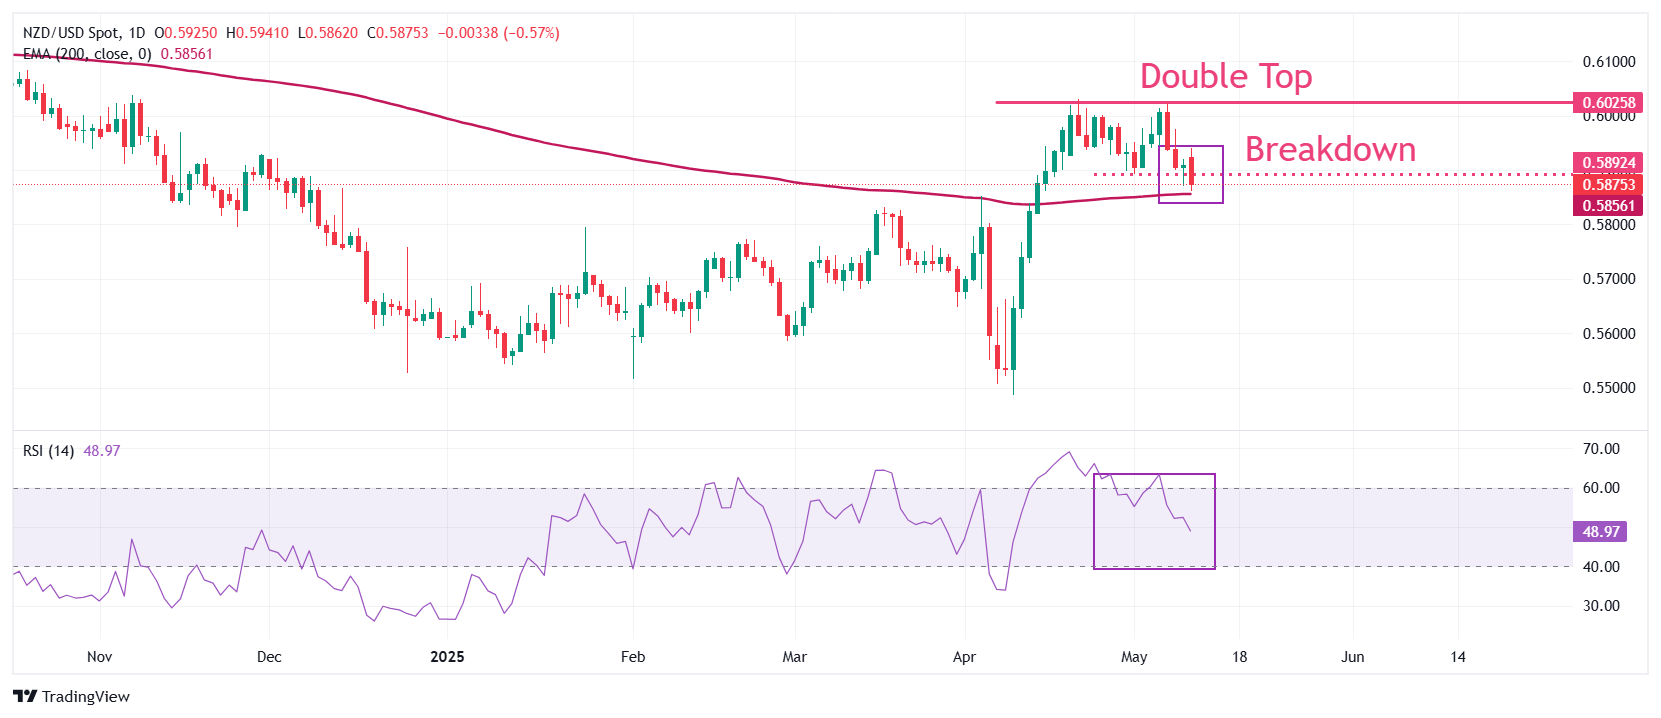
NZD/USD slides to near 0.5870 on a breakdown of the Double Bottom formation on a daily timeframe after breaking below the last higher low of 0.5890. The pair has fallen to near the 200-day Exponential Moving Average (EMA), which trades around 0.5860. The overall trend will turn bearish if the asset slides below the 200-day EMA.
The 14-day Relative Strength Index (RSI) falls to near 50.00. A fresh bearish momentum would appear if the RSI falls below 40.00.
More downside towards the April 4 high of 0.5803 and the April 11 low of 0.5730 would appear if the pair extends its downside below the 200-day EMA of 0.5860.
In an alternate scenario, an upside move towards the October 9 low of 0.6052 and the round level of 0.6100 looks likely if the pair breaks above the psychological level of 0.6000.
NZD/USD daily chart
Tariffs FAQs
Tariffs are customs duties levied on certain merchandise imports or a category of products. Tariffs are designed to help local producers and manufacturers be more competitive in the market by providing a price advantage over similar goods that can be imported. Tariffs are widely used as tools of protectionism, along with trade barriers and import quotas.
Although tariffs and taxes both generate government revenue to fund public goods and services, they have several distinctions. Tariffs are prepaid at the port of entry, while taxes are paid at the time of purchase. Taxes are imposed on individual taxpayers and businesses, while tariffs are paid by importers.
There are two schools of thought among economists regarding the usage of tariffs. While some argue that tariffs are necessary to protect domestic industries and address trade imbalances, others see them as a harmful tool that could potentially drive prices higher over the long term and lead to a damaging trade war by encouraging tit-for-tat tariffs.
During the run-up to the presidential election in November 2024, Donald Trump made it clear that he intends to use tariffs to support the US economy and American producers. In 2024, Mexico, China and Canada accounted for 42% of total US imports. In this period, Mexico stood out as the top exporter with $466.6 billion, according to the US Census Bureau. Hence, Trump wants to focus on these three nations when imposing tariffs. He also plans to use the revenue generated through tariffs to lower personal income taxes.
Author

Sagar Dua
FXStreet
Sagar Dua is associated with the financial markets from his college days. Along with pursuing post-graduation in Commerce in 2014, he started his markets training with chart analysis.