NZD/USD Price Forecast: Remains below 0.5750 near nine-day EMA
- NZD/USD may find its initial support at the psychological level of 0.5700.
- The 14-day Relative Strength Index remains near the 30 mark, indicating a bearish bias is active.
- The initial barrier lies within “the 0.5750 - 0.5775, the nine-day EMA” range.

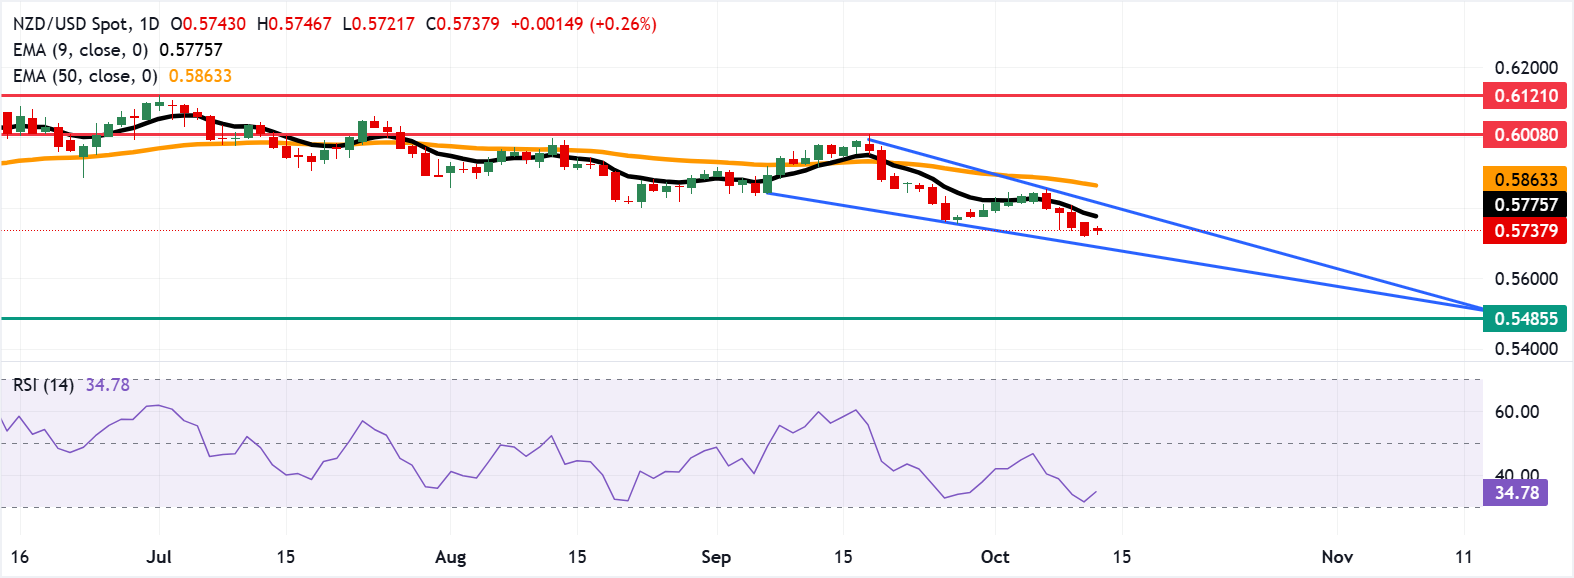
NZD/USD extends its losses for the fifth successive session, trading around 0.5740 during the early European hours on Monday. The daily chart’s technical analysis signals a potential bullish reversal as the pair price moves ahead in the descending wedge pattern. A continuation within the descending wedge suggests that volume typically declines, showing waning momentum in the bearish trend.
The 14-day Relative Strength Index (RSI) is positioned slightly below the 30 mark, suggesting a bearish bias is active. Although the NZD/USD pair could recover from the oversold territory. Further movements will likely offer a clear directional trend. Additionally, the short-term price momentum is weaker as the pair trades below the nine-day Exponential Moving Average (EMA).
On the downside, the NZD/USD pair could find its initial support at the psychological level of 0.5700, followed by the lower boundary of the descending wedge around 0.5690. A break below the wedge pattern would reinforce the bearish bias and put downward pressure on the pair to navigate the area around 0.5485, the lowest level since March 2020, which was recorded on April 9, 2025.
The NZD/USD pair may target its primary barrier at the nine-day EMA of 0.5775, followed by the descending wedge’s upper boundary around 0.5830. A break above this confluence resistance zone would cause the emergence of the bullish bias and support the pair to test the 50-day EMA at 0.5863.
Further advances would improve the medium-term price momentum and lead the NZD/USD pair to test the three-month high of 0.6008, reached on September 17, followed by 0.6121, the highest since October 2024.
NZD/USD: Daily Chart
New Zealand Dollar Price Today
The table below shows the percentage change of New Zealand Dollar (NZD) against listed major currencies today. New Zealand Dollar was the weakest against the Australian Dollar.
| USD | EUR | GBP | JPY | CAD | AUD | NZD | CHF | |
|---|---|---|---|---|---|---|---|---|
| USD | 0.13% | 0.10% | 0.20% | 0.07% | -0.15% | 0.09% | 0.12% | |
| EUR | -0.13% | -0.04% | 0.11% | -0.07% | -0.19% | -0.03% | -0.02% | |
| GBP | -0.10% | 0.04% | 0.18% | -0.04% | -0.17% | 0.00% | -0.01% | |
| JPY | -0.20% | -0.11% | -0.18% | -0.19% | -0.41% | -0.07% | -0.13% | |
| CAD | -0.07% | 0.07% | 0.04% | 0.19% | -0.25% | 0.04% | 0.03% | |
| AUD | 0.15% | 0.19% | 0.17% | 0.41% | 0.25% | 0.18% | 0.17% | |
| NZD | -0.09% | 0.03% | -0.00% | 0.07% | -0.04% | -0.18% | -0.01% | |
| CHF | -0.12% | 0.02% | 0.00% | 0.13% | -0.03% | -0.17% | 0.01% |
The heat map shows percentage changes of major currencies against each other. The base currency is picked from the left column, while the quote currency is picked from the top row. For example, if you pick the New Zealand Dollar from the left column and move along the horizontal line to the US Dollar, the percentage change displayed in the box will represent NZD (base)/USD (quote).
Author

Akhtar Faruqui
FXStreet
Akhtar Faruqui is a Forex Analyst based in New Delhi, India. With a keen eye for market trends and a passion for dissecting complex financial dynamics, he is dedicated to delivering accurate and insightful Forex news and analysis.