NZD/USD Price Forecast: Moves below 0.5850 toward an oversold zone
- NZD/USD depreciates toward the oversold region around the lower boundary of the descending channel at 0.5810 level.
- The nine-day EMA remains below the 14-day EMA, signaling continued weakness in short-term price momentum.
- The immediate resistance appears at the nine-day EMA at the level of 0.5875, followed by the descending channel’s lower boundary.

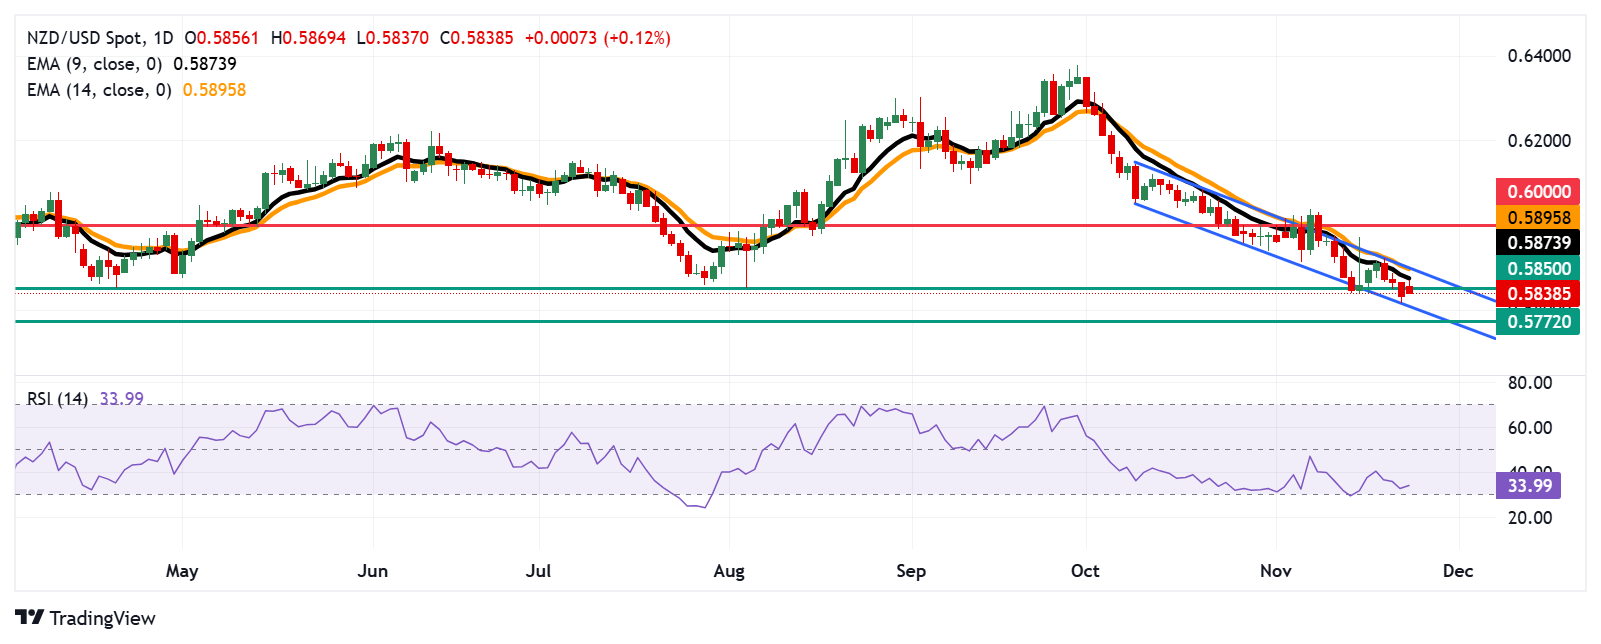
The NZD/USD pair continues its losing streak for the fourth consecutive day, trading near 0.5840 during European hours on Monday. An analysis of the daily chart indicates a strengthening bearish trend, as the pair remains confined within a descending channel pattern.
The nine-day Exponential Moving Average (EMA) stays below the 14-day EMA, indicating sustained weakness in short-term price momentum. Additionally, the 14-day Relative Strength Index (RSI) hovers just above the 30 mark, underscoring bearish sentiment. A drop below 30 would signal oversold conditions, potentially setting the stage for a corrective rebound.
On the downside, the NZD/USD pair may find support near the lower boundary of the descending channel, around 0.5810 level. A decisive break below this level would reinforce the bearish outlook, intensifying downward pressure and possibly pushing the pair toward its two-year low of 0.5772 level, last recorded in November 2023.
Regarding its upside, immediate resistance is located at the nine-day EMA at the level of 0.5873, followed by the 14-day EMA at 0.5895 level, aligning with the upper boundary of the descending channel. A breakout above the descending channel could diminish bearish momentum, opening the door for the pair to target the psychological level of 0.6000.
NZD/USD: Daily Chart
New Zealand Dollar PRICE Today
The table below shows the percentage change of New Zealand Dollar (NZD) against listed major currencies today. New Zealand Dollar was the weakest against the Swiss Franc.
| USD | EUR | GBP | JPY | CAD | AUD | NZD | CHF | |
|---|---|---|---|---|---|---|---|---|
| USD | -0.31% | -0.20% | 0.29% | 0.13% | 0.06% | 0.31% | -0.07% | |
| EUR | 0.31% | -0.06% | -0.03% | -0.15% | 0.30% | 0.04% | -0.34% | |
| GBP | 0.20% | 0.06% | 0.04% | -0.08% | 0.37% | 0.10% | -0.28% | |
| JPY | -0.29% | 0.03% | -0.04% | -0.14% | 0.21% | 0.09% | -0.16% | |
| CAD | -0.13% | 0.15% | 0.08% | 0.14% | 0.08% | 0.19% | -0.23% | |
| AUD | -0.06% | -0.30% | -0.37% | -0.21% | -0.08% | -0.26% | -0.64% | |
| NZD | -0.31% | -0.04% | -0.10% | -0.09% | -0.19% | 0.26% | -0.38% | |
| CHF | 0.07% | 0.34% | 0.28% | 0.16% | 0.23% | 0.64% | 0.38% |
The heat map shows percentage changes of major currencies against each other. The base currency is picked from the left column, while the quote currency is picked from the top row. For example, if you pick the New Zealand Dollar from the left column and move along the horizontal line to the US Dollar, the percentage change displayed in the box will represent NZD (base)/USD (quote).
Author

Akhtar Faruqui
FXStreet
Akhtar Faruqui is a Forex Analyst based in New Delhi, India. With a keen eye for market trends and a passion for dissecting complex financial dynamics, he is dedicated to delivering accurate and insightful Forex news and analysis.


