NZD/USD Price Forecast: Maintains position above nine-day EMA near 0.5600
- NZD/USD tests the nine-day EMA at 0.5604, followed by the psychological level of 0.5600.
- The short-term price momentum is improved as the pair moves above the nine-day EMA.
- The pair finds its initial resistance at the 14-day EMA of 0.5614 level.

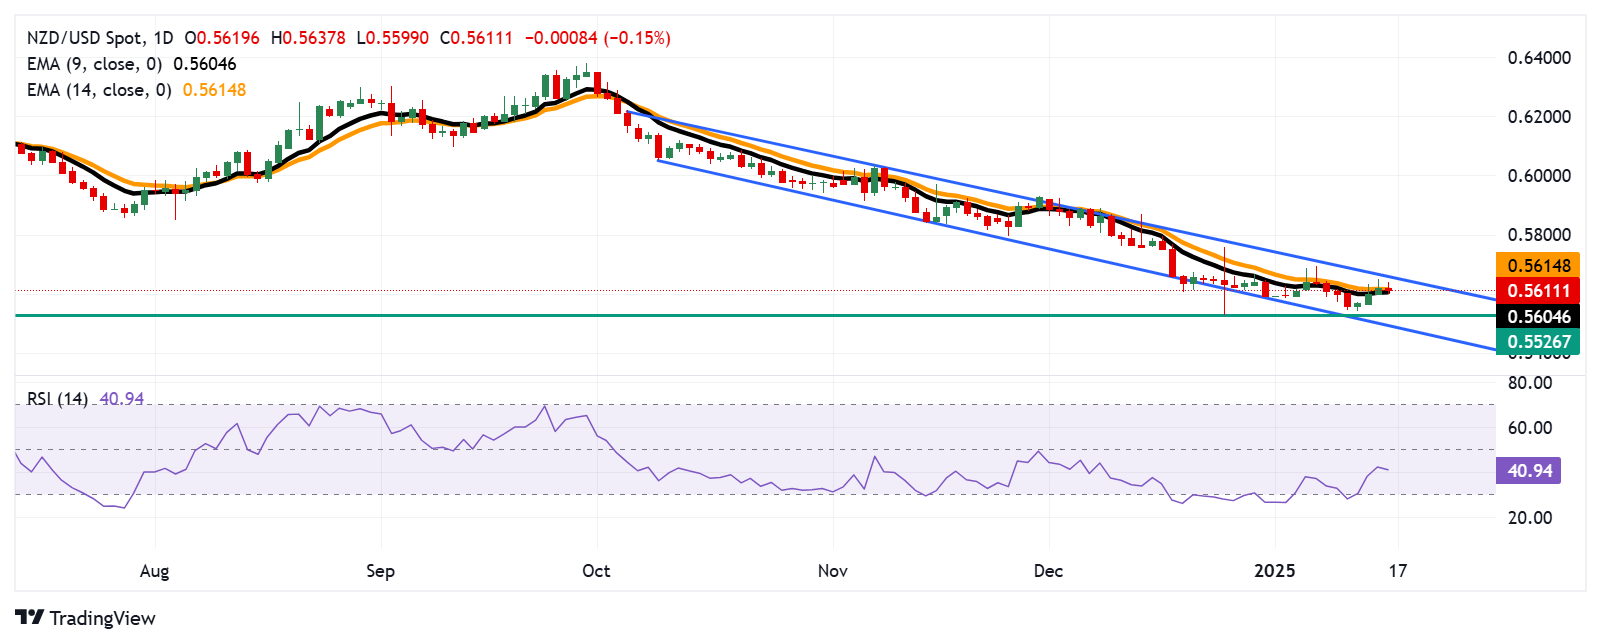
The NZD/USD pair breaks its three-day winning streak, trading around 0.5610 during the European hours on Thursday. The technical analysis of the daily chart indicates a persistent bearish bias as the pair is confined within a descending channel pattern.
The 14-day Relative Strength Index (RSI) remains below the 50 level, signaling an ongoing bearish bias. However, the NZD/USD pair moves above nine-day Exponential Moving Averages (EMA), reflecting an improvement in the short-term price momentum.
Regarding its support, the NZD/USD pair tests immediate nine-day EMA at 0.5604, aligned with the psychological level of 0.5600. A break below this level could lead the pair to navigate the region around its support area at 0.5526—its lowest point since October 2022, reached on December 25. Further support appears near the lower edge of its descending channel at the 0.5500 level.
On the upside, the NZD/USD pair tests initial resistance at the 14-day EMA at 0.5614 level. A break above this level could improve the short-term price momentum and support the pair to test the descending channel’s upper boundary at the psychological level of 0.5660 level.
NZD/USD: Daily Chart
New Zealand Dollar PRICE Today
The table below shows the percentage change of New Zealand Dollar (NZD) against listed major currencies today. New Zealand Dollar was the weakest against the Japanese Yen.
| USD | EUR | GBP | JPY | CAD | AUD | NZD | CHF | |
|---|---|---|---|---|---|---|---|---|
| USD | -0.01% | 0.19% | -0.25% | 0.22% | 0.18% | 0.16% | -0.11% | |
| EUR | 0.01% | 0.20% | -0.24% | 0.23% | 0.19% | 0.17% | -0.10% | |
| GBP | -0.19% | -0.20% | -0.40% | 0.03% | -0.01% | -0.03% | -0.30% | |
| JPY | 0.25% | 0.24% | 0.40% | 0.49% | 0.44% | 0.38% | 0.16% | |
| CAD | -0.22% | -0.23% | -0.03% | -0.49% | -0.04% | -0.07% | -0.33% | |
| AUD | -0.18% | -0.19% | 0.01% | -0.44% | 0.04% | -0.02% | -0.28% | |
| NZD | -0.16% | -0.17% | 0.03% | -0.38% | 0.07% | 0.02% | -0.26% | |
| CHF | 0.11% | 0.10% | 0.30% | -0.16% | 0.33% | 0.28% | 0.26% |
The heat map shows percentage changes of major currencies against each other. The base currency is picked from the left column, while the quote currency is picked from the top row. For example, if you pick the New Zealand Dollar from the left column and move along the horizontal line to the US Dollar, the percentage change displayed in the box will represent NZD (base)/USD (quote).
Author

Akhtar Faruqui
FXStreet
Akhtar Faruqui is a Forex Analyst based in New Delhi, India. With a keen eye for market trends and a passion for dissecting complex financial dynamics, he is dedicated to delivering accurate and insightful Forex news and analysis.


