NZD/USD Price Forecast: Holds losses near 0.6000, nine-day EMA
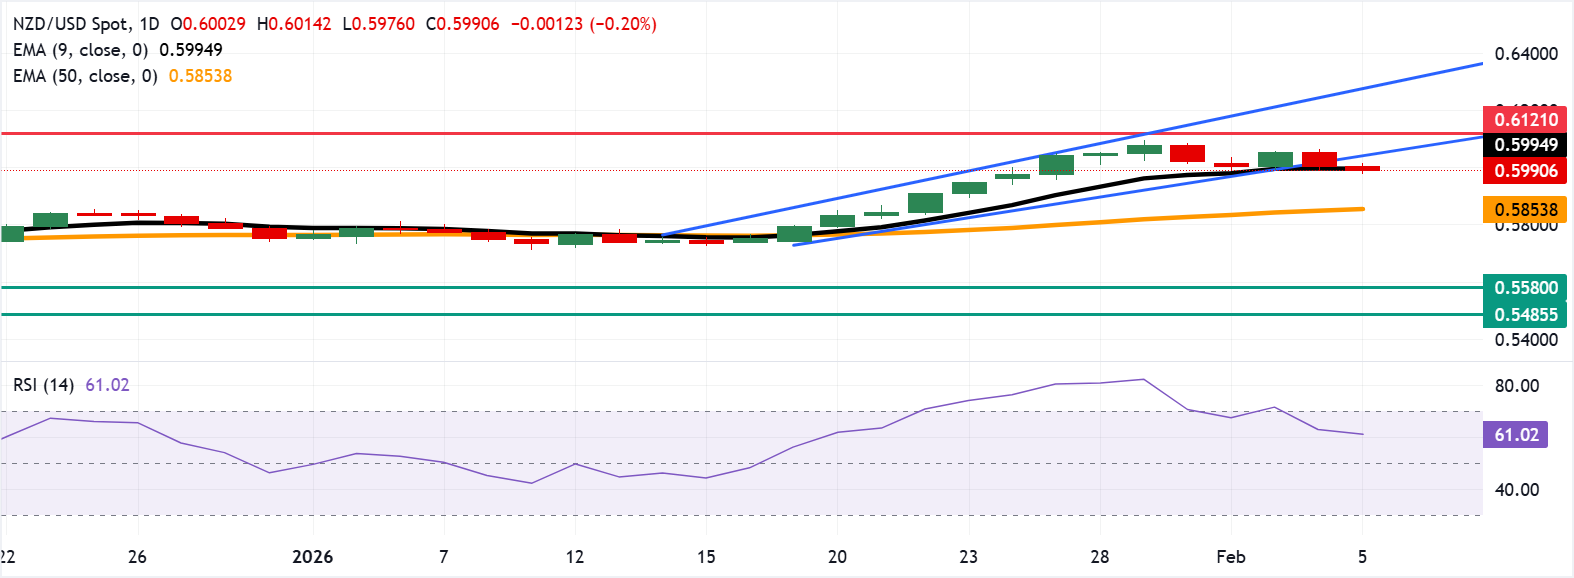
- NZD/USD could find an immediate barrier at the nine-day EMA of 0.5994.
- The 14-day Relative Strength Index at 60 has cooled, signaling momentum consolidation rather than a reversal.
- The primary support lies at the 50-day EMA at 0.5853.

NZD/USD remains subdued for the second consecutive day, trading around 0.5990 during the early European hours on Thursday. The technical analysis of the daily chart signals a potential for bearish reversal as the pair price is positioned slightly below the lower ascending channel boundary.
The nine-day Exponential Moving Average (EMA) rises above the 50-day EMA, sustaining a bullish bias, while the NZD/USD pair holds above the medium-term average. With moving averages aligned to the upside, a close back above the nine-day EMA could unlock further extension.
The 14-day Relative Strength Index (RSI) at 60 (neutral-bullish) has cooled from recent extremes, pointing to momentum consolidation rather than reversal. RSI holding above 50 would keep dips shallow; a slide toward the midline would flag waning traction.
The immediate barrier lies at the nine-day EMA of 0.5994. A rebound above the short-term average would support the pair to return to the ascending channel and target the 16-month high of 0.6121, which was recorded in July 2025. Further advances would lead the NZD/USD pair to explore the region around the upper boundary of the ascending channel at 0.6270.
On the downside, the NZD/USD pair may fall toward the 50-day EMA at 0.5853. A break below the medium-term average would put downward pressure on the pair to navigate the region around the 10-month low of 0.5580.
(The technical analysis of this story was written with the help of an AI tool.)
New Zealand Dollar FAQs
The New Zealand Dollar (NZD), also known as the Kiwi, is a well-known traded currency among investors. Its value is broadly determined by the health of the New Zealand economy and the country’s central bank policy. Still, there are some unique particularities that also can make NZD move. The performance of the Chinese economy tends to move the Kiwi because China is New Zealand’s biggest trading partner. Bad news for the Chinese economy likely means less New Zealand exports to the country, hitting the economy and thus its currency. Another factor moving NZD is dairy prices as the dairy industry is New Zealand’s main export. High dairy prices boost export income, contributing positively to the economy and thus to the NZD.
The Reserve Bank of New Zealand (RBNZ) aims to achieve and maintain an inflation rate between 1% and 3% over the medium term, with a focus to keep it near the 2% mid-point. To this end, the bank sets an appropriate level of interest rates. When inflation is too high, the RBNZ will increase interest rates to cool the economy, but the move will also make bond yields higher, increasing investors’ appeal to invest in the country and thus boosting NZD. On the contrary, lower interest rates tend to weaken NZD. The so-called rate differential, or how rates in New Zealand are or are expected to be compared to the ones set by the US Federal Reserve, can also play a key role in moving the NZD/USD pair.
Macroeconomic data releases in New Zealand are key to assess the state of the economy and can impact the New Zealand Dollar’s (NZD) valuation. A strong economy, based on high economic growth, low unemployment and high confidence is good for NZD. High economic growth attracts foreign investment and may encourage the Reserve Bank of New Zealand to increase interest rates, if this economic strength comes together with elevated inflation. Conversely, if economic data is weak, NZD is likely to depreciate.
The New Zealand Dollar (NZD) tends to strengthen during risk-on periods, or when investors perceive that broader market risks are low and are optimistic about growth. This tends to lead to a more favorable outlook for commodities and so-called ‘commodity currencies’ such as the Kiwi. Conversely, NZD tends to weaken at times of market turbulence or economic uncertainty as investors tend to sell higher-risk assets and flee to the more-stable safe havens.
Author

Akhtar Faruqui
FXStreet
Akhtar Faruqui is a Forex Analyst based in New Delhi, India. With a keen eye for market trends and a passion for dissecting complex financial dynamics, he is dedicated to delivering accurate and insightful Forex news and analysis.


