NZD/USD Price Forecast: Falls toward lower boundary of channel near 0.6150
- NZD/USD could test the lower boundary of the ascending channel around 0.6160 level.
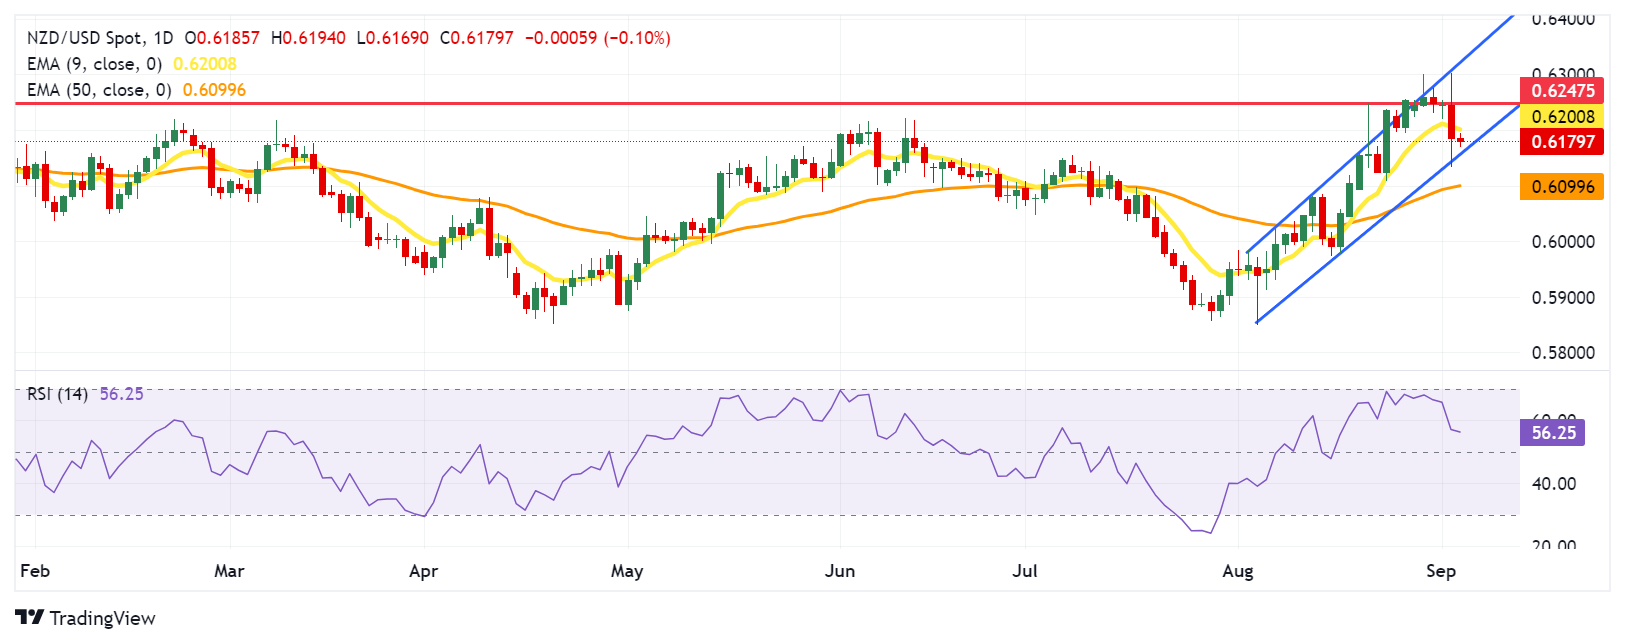
- The nine-day EMA is above the 50-day EMA, indicating that short-term upward momentum is likely to continue.
- A break above the nine-day EMA at 0.6201 level prompts the pair to revisit a seven-month high of 0.6247.

NZD/USD extends losses, trading around 0.6180 during the European hours on Wednesday. On the daily chart, the pair is positioned within the ascending channel, supporting a bullish bias.
Additionally, the 14-day Relative Strength Index (RSI) remains above the 50 level, confirming the overall bullish trend. However, if the RSI breaks the 50 mark, it could signal a potential momentum shift from a bullish to a bearish trend.
The nine-day Exponential Moving Average (EMA) is positioned above the 50-day EMA, signaling that the NZD/USD pair is experiencing short-term upward momentum and is likely to continue rising.
On the upside, the NZD/USD pair may encounter immediate resistance around the nine-day EMA at 0.6201 level, followed by the seven-month high of 0.6247, recorded on August 21. A break above this level could lead the pair to test the upper boundary of the ascending channel at 0.6320,
In terms of support, the NZD/USD pair may test the lower boundary of the ascending channel around the 0.6160 level. A break below this level could weaken the bullish bias and lead the pair to approach the area around the 50-day EMA at 0.6099.
NZD/USD: Daily Chart
New Zealand Dollar PRICE Today
The table below shows the percentage change of New Zealand Dollar (NZD) against listed major currencies today. New Zealand Dollar was the weakest against the Swiss Franc.
| USD | EUR | GBP | JPY | CAD | AUD | NZD | CHF | |
|---|---|---|---|---|---|---|---|---|
| USD | -0.09% | -0.07% | -0.19% | 0.07% | 0.11% | 0.10% | -0.19% | |
| EUR | 0.09% | 0.04% | -0.11% | 0.18% | 0.20% | 0.22% | -0.11% | |
| GBP | 0.07% | -0.04% | -0.13% | 0.14% | 0.16% | 0.19% | -0.14% | |
| JPY | 0.19% | 0.11% | 0.13% | 0.26% | 0.29% | 0.29% | -0.01% | |
| CAD | -0.07% | -0.18% | -0.14% | -0.26% | 0.02% | 0.05% | -0.28% | |
| AUD | -0.11% | -0.20% | -0.16% | -0.29% | -0.02% | 0.02% | -0.29% | |
| NZD | -0.10% | -0.22% | -0.19% | -0.29% | -0.05% | -0.02% | -0.32% | |
| CHF | 0.19% | 0.11% | 0.14% | 0.00% | 0.28% | 0.29% | 0.32% |
The heat map shows percentage changes of major currencies against each other. The base currency is picked from the left column, while the quote currency is picked from the top row. For example, if you pick the New Zealand Dollar from the left column and move along the horizontal line to the US Dollar, the percentage change displayed in the box will represent NZD (base)/USD (quote).
Author

Akhtar Faruqui
FXStreet
Akhtar Faruqui is a Forex Analyst based in New Delhi, India. With a keen eye for market trends and a passion for dissecting complex financial dynamics, he is dedicated to delivering accurate and insightful Forex news and analysis.


