NZD/USD Price Forecast: Breaks above 0.6000, next barrier appears near six-month highs
- NZD/USD could find the next barrier at the six-month high of 0.6038.
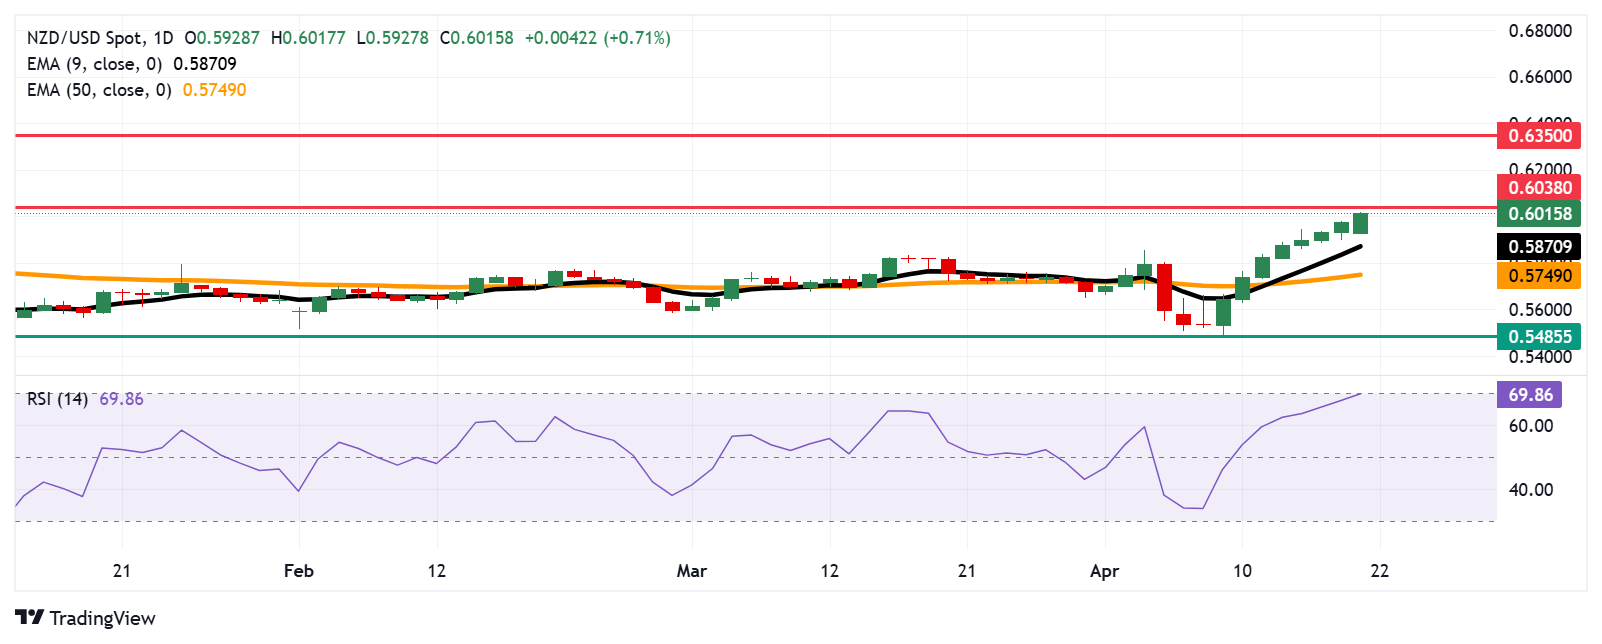
- If 14-day RSI breaks above 70, it could signal overbought conditions and raise the risk of a potential pullback.
- A break below the nine-day EMA at 0.5870 could undermine the short-term bullish momentum.

The NZD/USD pair extends its winning streak that began on April 9, trading around 0.6010 during early European trading hours on Thursday. Technical indicators on the daily chart point to a bullish bias, with the pair holding above the nine-day Exponential Moving Average (EMA).
However, the 14-day Relative Strength Index (RSI) sits just below the 70 level, supporting the prevailing bullish bias. A decisive break above 70, however, could signal overbought conditions and raise the risk of a potential pullback. Meanwhile, the nine-day EMA rises above the 50-day EMA, reinforcing the broader bullish trend and suggesting the potential for further upside.
On the upside, the NZD/USD pair could challenge the key resistance at the six-month high of 0.6038, last reached in November 2024. A sustained break above this level would likely strengthen the bullish outlook and open the door for a move toward the seven-month high near 0.6350, recorded in October 2024.
The primary support is located at the nine-day EMA of 0.5870. A break below this level could undermine the short-term bullish momentum and expose the NZD/USD pair to further downside toward the 50-day EMA at 0.5748. Additional support lies at 0.5485, a level not seen since March 2020.
NZD/USD: Daily Chart
New Zealand Dollar PRICE Today
The table below shows the percentage change of New Zealand Dollar (NZD) against listed major currencies today. New Zealand Dollar was the strongest against the US Dollar.
| USD | EUR | GBP | JPY | CAD | AUD | NZD | CHF | |
|---|---|---|---|---|---|---|---|---|
| USD | -1.45% | -0.90% | -1.11% | -0.37% | -0.78% | -1.41% | -1.54% | |
| EUR | 1.45% | 0.42% | 0.33% | 1.05% | 0.50% | 0.00% | -0.12% | |
| GBP | 0.90% | -0.42% | 0.08% | 0.64% | 0.08% | -0.40% | -0.53% | |
| JPY | 1.11% | -0.33% | -0.08% | 0.75% | 0.22% | -0.18% | -0.40% | |
| CAD | 0.37% | -1.05% | -0.64% | -0.75% | -0.53% | -1.04% | -1.16% | |
| AUD | 0.78% | -0.50% | -0.08% | -0.22% | 0.53% | -0.48% | -0.62% | |
| NZD | 1.41% | -0.01% | 0.40% | 0.18% | 1.04% | 0.48% | -0.11% | |
| CHF | 1.54% | 0.12% | 0.53% | 0.40% | 1.16% | 0.62% | 0.11% |
The heat map shows percentage changes of major currencies against each other. The base currency is picked from the left column, while the quote currency is picked from the top row. For example, if you pick the New Zealand Dollar from the left column and move along the horizontal line to the US Dollar, the percentage change displayed in the box will represent NZD (base)/USD (quote).
Author

Akhtar Faruqui
FXStreet
Akhtar Faruqui is a Forex Analyst based in New Delhi, India. With a keen eye for market trends and a passion for dissecting complex financial dynamics, he is dedicated to delivering accurate and insightful Forex news and analysis.


