NZD/USD Price Analysis: Technical setup on 4H continues to flag bearish risks


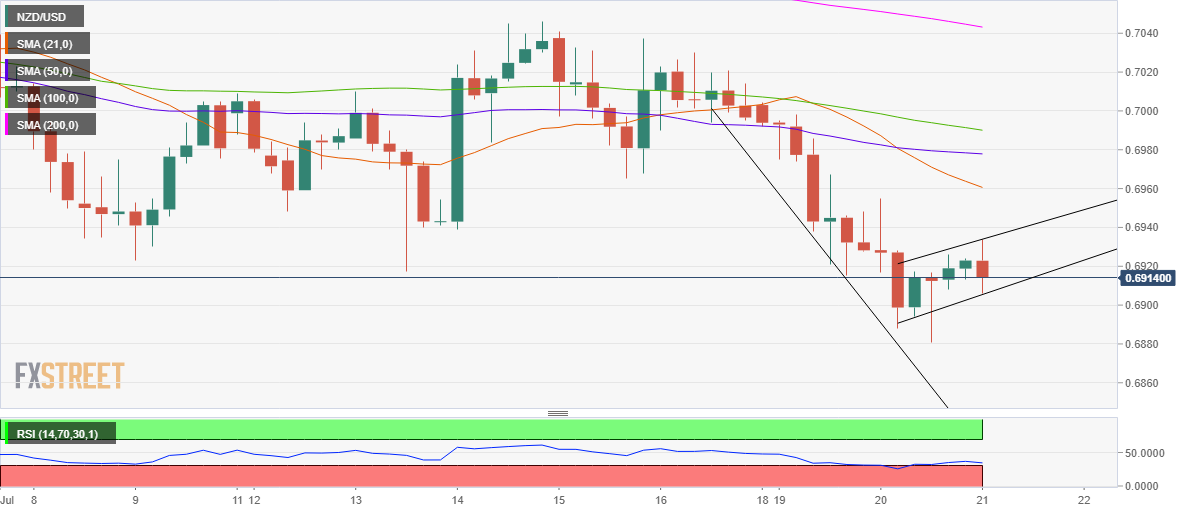
  • NZD/USD displays a bear flag on the four-hour chart.
  • Risk-off mood-led DXY strength keeps sellers hopeful.
  • RSI points south below the midline, allowing more declines.

NZD/USD is meandering near daily lows just above 0.6900, almost unchanged on the day, as the bears await a strong catalyst for the next move lower.

The return of risk-off trading in Asia, amid mounting concerns over the Delta covid strain cases and worries of economic slowdown once again, lifts the safe-haven demand for the US dollar at the expense of the risk-sensitive kiwi.

The Kiwi was the weakest across the G10 currencies on Tuesday, despite markets witnessing a brief turnaround. At the press time, the spot is trading at 0.6913, having hit daily lows at 0.6907.

Looking at it technically, the recent sell-off that followed a brief consolidative stint so far this Wednesday has taken the shape of a bear flag.

Bears now await a fresh impetus to yield a downside breakout of the bearish flag, by beating bullish commitments at 0.6905.

Sellers would then target the multi-month lows of 0.6881, below which the 0.6850 psychological level could come into play.

A sustained break above the rising trendline resistance at 0.6933 will invalidate the bearish formation, unleashing a meaningful recovery towards the downward-sloping 21-Simple Moving Average (SMA) at 0.6960.

However, the Relative Strength Index (RSI) pointing south while just above the oversold region, suggests that a potential downswing could be in the offing.

NZD/USD four-hour chart

NZD/USD additional levels to watch

NZD/USD

Overview
Today last price 0.6913
Today Daily Change -0.0003
Today Daily Change % -0.04
Today daily open 0.6918
 
Trends
Daily SMA20 0.6999
Daily SMA50 0.7104
Daily SMA100 0.7122
Daily SMA200 0.708
 
Levels
Previous Daily High 0.6955
Previous Daily Low 0.6881
Previous Weekly High 0.7046
Previous Weekly Low 0.6917
Previous Monthly High 0.7289
Previous Monthly Low 0.6923
Daily Fibonacci 38.2% 0.6909
Daily Fibonacci 61.8% 0.6927
Daily Pivot Point S1 0.6881
Daily Pivot Point S2 0.6844
Daily Pivot Point S3 0.6807
Daily Pivot Point R1 0.6955
Daily Pivot Point R2 0.6992
Daily Pivot Point R3 0.7029


Share: Feed news

Information on these pages contains forward-looking statements that involve risks and uncertainties. Markets and instruments profiled on this page are for informational purposes only and should not in any way come across as a recommendation to buy or sell in these assets. You should do your own thorough research before making any investment decisions. FXStreet does not in any way guarantee that this information is free from mistakes, errors, or material misstatements. It also does not guarantee that this information is of a timely nature. Investing in Open Markets involves a great deal of risk, including the loss of all or a portion of your investment, as well as emotional distress. All risks, losses and costs associated with investing, including total loss of principal, are your responsibility. The views and opinions expressed in this article are those of the authors and do not necessarily reflect the official policy or position of FXStreet nor its advertisers. The author will not be held responsible for information that is found at the end of links posted on this page.

If not otherwise explicitly mentioned in the body of the article, at the time of writing, the author has no position in any stock mentioned in this article and no business relationship with any company mentioned. The author has not received compensation for writing this article, other than from FXStreet.

FXStreet and the author do not provide personalized recommendations. The author makes no representations as to the accuracy, completeness, or suitability of this information. FXStreet and the author will not be liable for any errors, omissions or any losses, injuries or damages arising from this information and its display or use. Errors and omissions excepted.

The author and FXStreet are not registered investment advisors and nothing in this article is intended to be investment advice.

Recommended content


Recommended content

Editors’ Picks

EUR/USD hovers around 1.0700, eyes on US first-quarter GDP data

EUR/USD hovers around 1.0700, eyes on US first-quarter GDP data

EUR/USD hovers around the 1.0700 psychological level on Thursday during the early Thursday. The modest uptick of the major pair is supported by the softer US Dollar. Later in the day, Germany’s GfK Consumer Confidence Survey for April will be released. 

EUR/USD News

USD/JPY finds its highest bids since 1990, near 155.50

USD/JPY finds its highest bids since 1990, near 155.50

USD/JPY keeps breaking into its highest chart territory since June of 1990 early Thursday, testing 155.50 for the first time in 34 years as the Japanese Yen remains vulnerable, despite looming Japanese intervention risks. Focus shifts to Thursday's US GDP report and the BoJ decision on Friday. 

USD/JPY News

Gold price lacks firm intraday direction, holds steady above $2,300 ahead of US data

Gold price lacks firm intraday direction, holds steady above $2,300 ahead of US data

Gold price remains confined in a narrow band for the second straight day on Thursday. Reduced Fed rate cut bets and a positive risk tone cap the upside for the commodity. Traders now await key US macro data before positioning for the near-term trajectory.

Gold News

Injective price weakness persists despite over 5.9 million INJ tokens burned

Injective price weakness persists despite over 5.9 million INJ tokens burned

Injective price is trading with a bearish bias, stuck in the lower section of the market range. The bearish outlook abounds despite the network's deflationary efforts to pump the price. Coupled with broader market gloom, INJ token’s doomed days may not be over yet.

Read more

Meta Platforms Earnings: META sinks 10% on lower Q2 revenue guidance Premium

Meta Platforms Earnings: META sinks 10% on lower Q2 revenue guidance

This must be "opposites" week. While Doppelganger Tesla rode horrible misses on Tuesday to a double-digit rally, Meta Platforms produced impressive beats above Wall Street consensus after the close on Wednesday, only to watch the share price collapse by nearly 10%.

Read more

Forex MAJORS

Cryptocurrencies

Signatures