|

NZD/USD Price Analysis: Range-bound trade grapples with conflicting signals

  • NZD/USD dips on Tuesday, hovering near 0.5670 amid a sideways pattern.
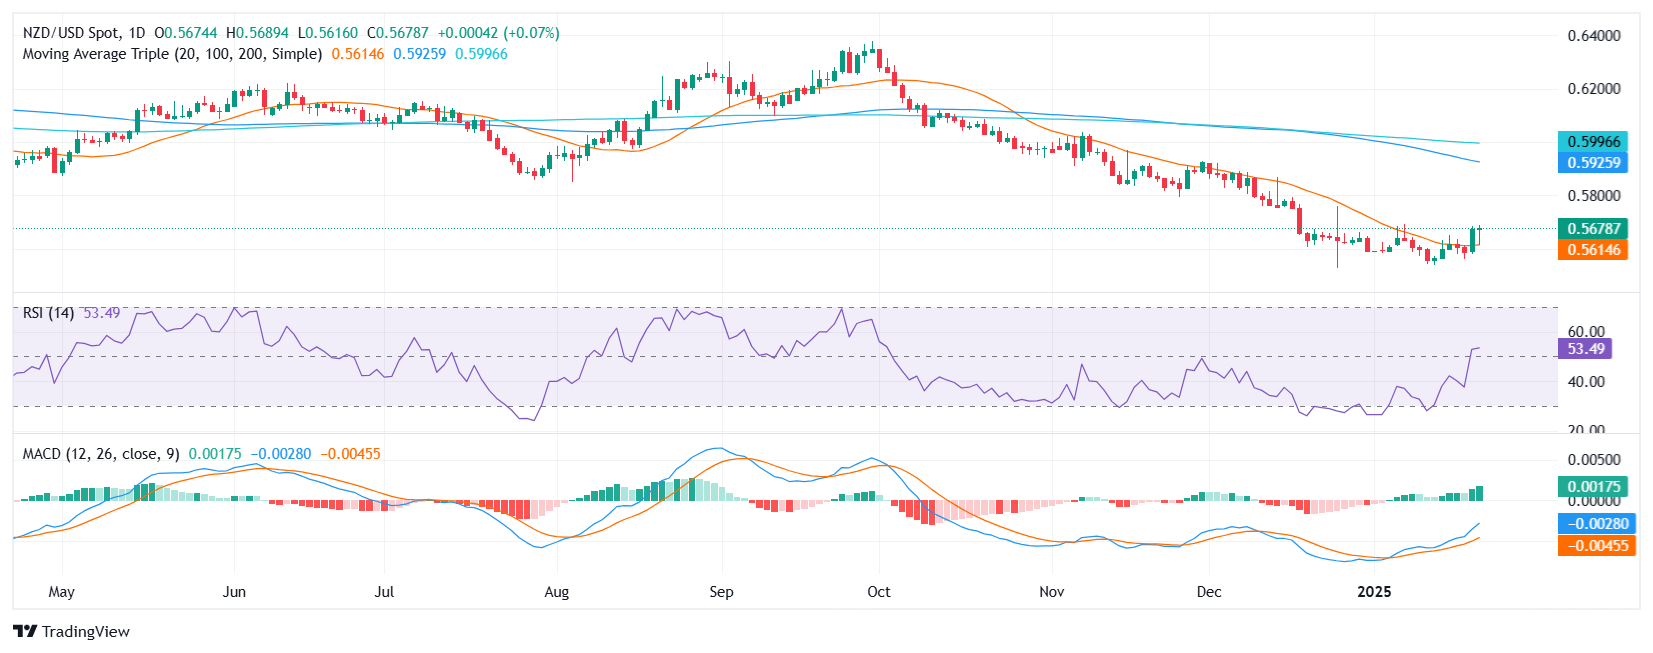
  • RSI stands at 54, hinting at positive momentum yet showing signs of a pullback.

NZD/USD edged lower to 0.5670 on Tuesday, extending its recent stretch of range-bound action between 0.5690 and 0.5565. The pair’s inability to sustain a decisive move outside this corridor highlights traders’ indecision, with buyers and sellers each awaiting a clearer catalyst. Despite slipping slightly, NZD/USD remains close to the upper band of its established consolidation zone.

Technical readings offer a mixed outlook. Although the Relative Strength Index (RSI) stands at 54 in positive territory, it has shown signs of moderating from previous levels, suggesting that upward momentum may be losing steam. In contrast, the Moving Average Convergence Divergence (MACD) histogram is displaying rising green bars—often taken as an indication that buyers have not completely bowed out. As a result, the pair appears to be at a crossroads, needing a stronger push from either side.

Looking ahead, an upside break above 0.5690 would signal a potential bullish extension, possibly targeting 0.5720 or higher if momentum holds. On the downside, failure to maintain current levels could see bears aiming for 0.5565, which has served as a reliable floor throughout the recent consolidation.

NZD/USD daily chart

Author

Patricio Martín

Patricio is an economist from Argentina passionate about global finance and understanding the daily movements of the markets.

More from Patricio Martín
Share:

Markets move fast. We move first.

Orange Juice Newsletter brings you expert driven insights - not headlines. Every day on your inbox.

By subscribing you agree to our Terms and conditions.

Editor's Picks

EUR/USD clings to small gains near 1.1750

Following a short-lasting correction in the early European session, EUR/USD regains its traction and clings to moderate gains at around 1.1750 on Monday. Nevertheless, the pair's volatility remains low, with investors awaiting this weeks key US data releases and the ECB policy announcements.

GBP/USD edges higher toward 1.3400 as traders await key data and BoE

GBP/USD reverses its direction and advances toward 1.3400 following a drop to the 1.3350 area earlier in the day. The US Dollar struggles to gather recovery momentum as markets await Tuesday's Nonfarm Payrolls data, while the Pound Sterling holds steady ahead of the BoE policy announcements later in the week.

Gold builds on previous week's gains, approaches $4,350

Gold preserves its bullish momentum after rising more than 2% last week and climbs toward $4,350 on Monday. The precious metal extends its upside as the US Dollar remains on the back foot on growing expectations for a dovish Fed policy outlook next year.

Solana consolidates as spot ETF inflows near $1 billion signal institutional dip-buying

Solana price hovers above $131 at the time of writing on Monday, nearing the upper boundary of a falling wedge pattern, awaiting a decisive breakout. On the institutional side, demand for spot Solana Exchange-Traded Funds remained firm, pushing total assets under management to nearly $1 billion since launch. 

Big week ends with big doubts

The S&P 500 continued to push higher yesterday as the US 2-year yield wavered around the 3.50% mark following a Federal Reserve (Fed) rate cut earlier this week that was ultimately perceived as not that hawkish after all. The cut is especially boosting the non-tech pockets of the market.

Solana Price Forecast: SOL consolidates as spot ETF inflows near $1 billion signal institutional dip-buying

Solana (SOL) price hovers above $131 at the time of writing on Monday, nearing the upper boundary of a falling wedge pattern, awaiting a decisive breakout.