|

NZD/USD Price Analysis: Pulls back from 200-SMA despite firmer China GDP

  • NZD/USD retreats from two-week high even as China Q3 GDP grew better than forecast.
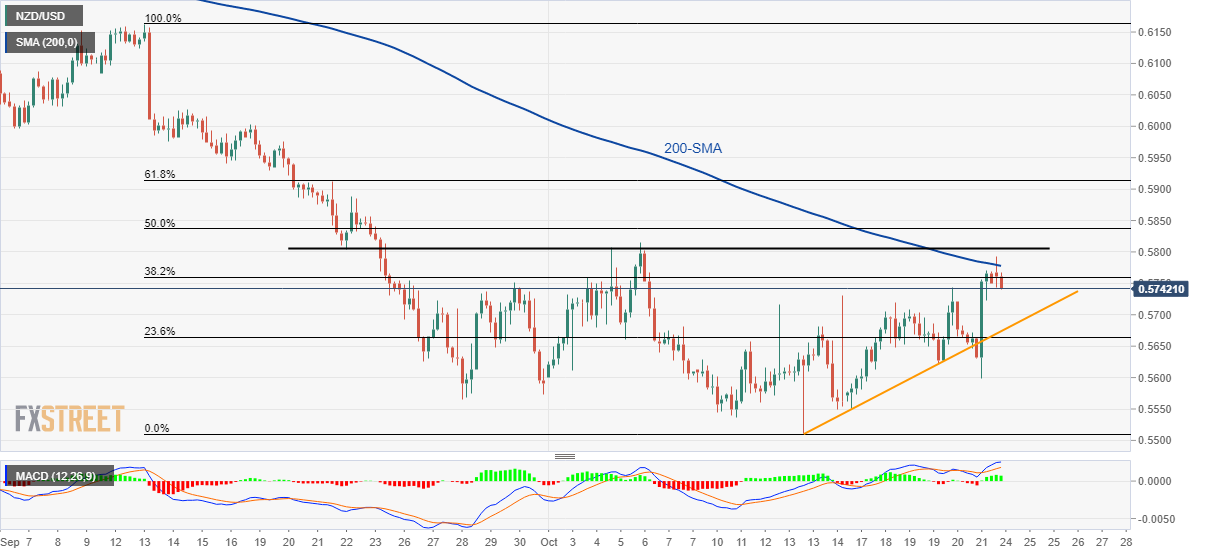
  • MACD signals, rebound from one-week-old rising trend line favor buyers.
  • One-month-old horizontal resistance acts as extra filters to the north.

NZD/USD fails to justify upbeat China data as it drops to 0.5745 while extending the week-start pullback from the 12-day high during Monday’s Asian session.

Also read: China GDP (YoY) Q3: 3.9% (exp 3.3% vs. prev 0.4%), Aussie remains volatile

In doing so, the Kiwi pair retreats from the 200-SMA and ignores the bullish MACD signals.

With this, the quote’s further downside becomes questionable unless it breaks the one-week-old support line, around 0.5675 by the press time.

Following that, a downward trajectory towards refreshing the yearly low near 0.5510 can’t be ruled out.

It should be noted that the NZD/USD pair’s weakness past 0.5510 needs validation from the 0.5500 threshold and the year 2020 bottom surrounding 0.5470 to keep the bears on the table.

Alternatively, recovery moves will initially need to cross the 200-SMA hurdle near 0.5780 to convince intraday buyers before challenging a one-month-old horizontal resistance area surrounding 0.5805-10.

Should the Kiwi pair buyers manage to keep the reins past 0.5810, the quote can aim for the 0.6000 psychological magnet and the previous monthly peak surrounding 0.6165.

Overall, NZD/USD remains on the short-term seller's radar but the downside appears limited.

NZD/USD: Four-hour chart

Trend: Limited downside expected

Additional important levels

Overview
Today last price0.5749
Today Daily Change-0.0001
Today Daily Change %-0.02%
Today daily open0.575
 
Trends
Daily SMA200.5661
Daily SMA500.592
Daily SMA1000.6096
Daily SMA2000.6387
 
Levels
Previous Daily High0.5771
Previous Daily Low0.5599
Previous Weekly High0.5771
Previous Weekly Low0.5551
Previous Monthly High0.6162
Previous Monthly Low0.5565
Daily Fibonacci 38.2%0.5705
Daily Fibonacci 61.8%0.5665
Daily Pivot Point S10.5643
Daily Pivot Point S20.5535
Daily Pivot Point S30.5471
Daily Pivot Point R10.5815
Daily Pivot Point R20.5879
Daily Pivot Point R30.5987

Author

Anil Panchal

Anil Panchal

FXStreet

Anil Panchal has nearly 15 years of experience in tracking financial markets. With a keen interest in macroeconomics, Anil aptly tracks global news/updates and stays well-informed about the global financial moves and their implications.

More from Anil Panchal
Share:

Markets move fast. We move first.

Orange Juice Newsletter brings you expert driven insights - not headlines. Every day on your inbox.

By subscribing you agree to our Terms and conditions.

Editor's Picks

EUR/USD eyes 1.1800 barrier near two-month highs

EUR/USD extends its gains for the second successive session, trading around 1.1780 during the Asian hours on Tuesday. On the daily chart, technical analysis indicates a persistent bullish bias, as the pair moves upward within the ascending channel pattern. Additionally, the 14-day Relative Strength Index at 68.89 sits near overbought, signaling strong demand. RSI remains elevated, which could cap gains if overbought conditions emerge.

GBP/USD knocks ten-week highs ahead of holiday slowdown

GBP/USD found room on the high side on Monday, kicking off a holiday-shortened trading week with a fresh spat of Greenback weakness, bolstering the Pound Sterling into its highest bids in ten weeks. Pound traders are largely brushing off the latest interest rate cut from the Bank of England as the UK’s central bank policy strategy leaves the water murky for rate-cut watchers.

Gold bulls seem unstoppable amid supportive fundamental backdrop

Gold is seen building on the previous day's strong rally of over 2% and continues scaling new all-time highs for the second consecutive day on Tuesday. The commodity climbs closer to the $4,500 psychological mark during the Asian session and remains well supported by a combination of factors. 

Uniswap holds above $6 as traders eye UNIfication vote outcome

Uniswap price holds above $6 at the time of writing on Tuesday after closing above a key resistance zone in the previous week. Traders are focusing on the highly anticipated UNIfication proposal, which is set to conclude on Thursday, and could become a key near-term catalyst. On the technical side, momentum indicators are flashing bullish signals, hinting at an upside rally.

Ten questions that matter going into 2026

2026 may be less about a neat “base case” and more about a regime shift—the market can reprice what matters most (growth, inflation, fiscal, geopolitics, concentration). The biggest trap is false comfort: the same trades can look defensive… right up until they become crowded.

XRP steadies above $1.90 support as fund inflows and retail demand rise

Ripple (XRP) is stable above support at $1.90 at the time of writing on Monday, after several attempts to break above the $2.00 hurdle failed to materialize last week. Meanwhile, institutional interest in the cross-border remittance token has remained steady.