|

NZD/USD Price Analysis: Pair tumbles to fresh multi-month low before paring losses

  • NZD/USD drops 0.59% on Monday, hitting 0.5515, its lowest level since October 2022.
  • The pair staged a partial recovery to 0.5595 but remains under heavy bearish pressure.
  • RSI stays flat in negative territory, while MACD histogram shows decreasing green bars, signaling fading bullish attempts.

The NZD/USD pair extended its downward trajectory on Monday, falling sharply to 0.5515, its lowest point in over a year, before managing a slight rebound to settle at 0.5595. Despite the brief recovery, the pair remains trapped in a bearish structure, with sellers firmly in control amid persistent downside momentum.

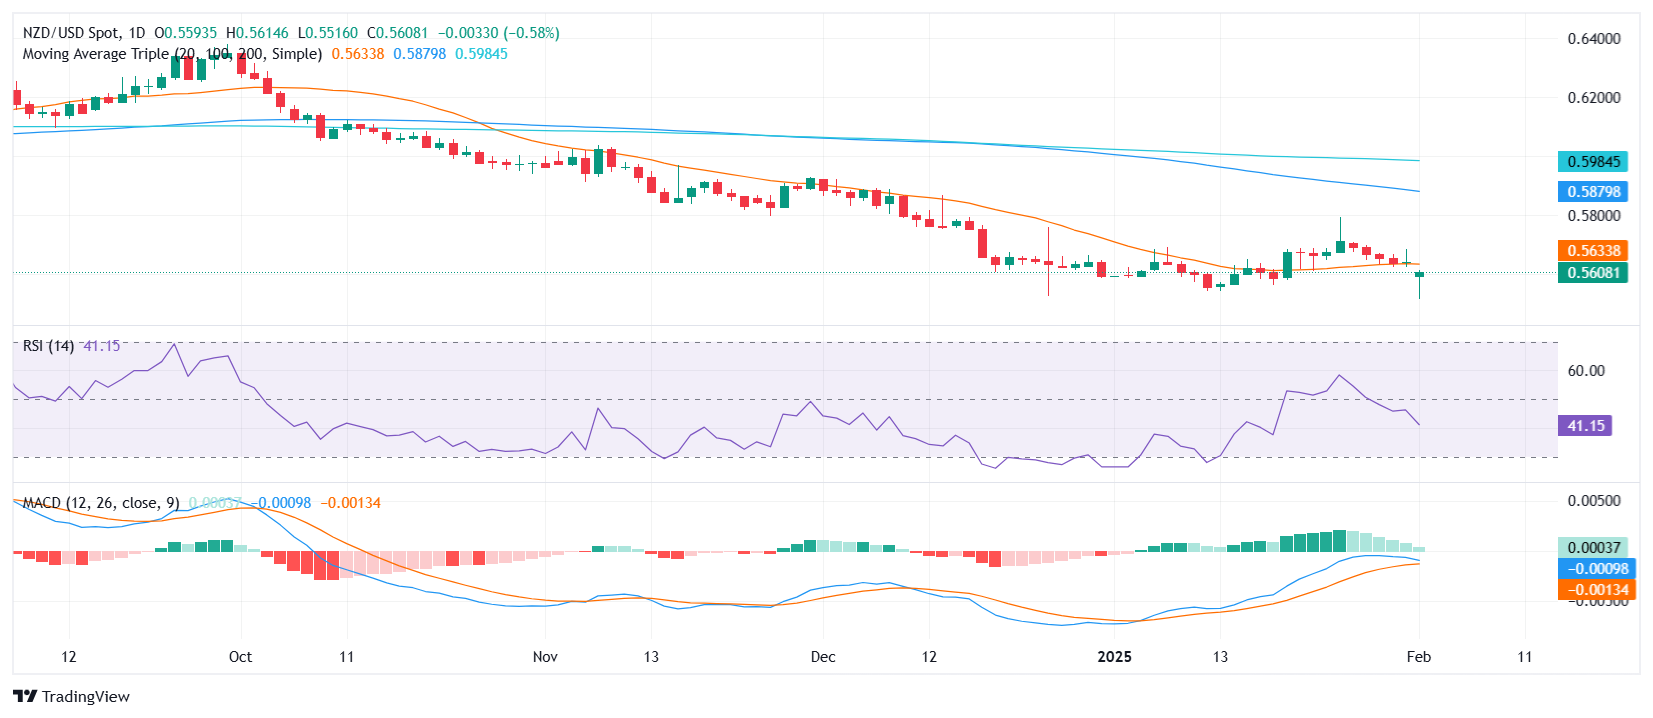
Technical indicators confirm the lack of strong buying interest. The Relative Strength Index (RSI) points down at 41 in negative territory, suggesting that selling pressure has yet to ease. Meanwhile, the Moving Average Convergence Divergence (MACD) histogram is printing decreasing green bars, pointing to waning bullish momentum and reinforcing the broader downtrend.

For now, support is seen at 0.5515, and a sustained break below this level could expose further downside toward 0.5480. On the other hand, if the pair attempts a rebound, initial resistance is found at 0.5620, followed by the 20-day Simple Moving Average (SMA) near 0.5630. As long as NZD/USD trades below this key threshold, the broader bearish outlook is expected to persist.

NZD/USD daily chart

Author

Patricio Martín

Patricio is an economist from Argentina passionate about global finance and understanding the daily movements of the markets.

More from Patricio Martín
Share:

Markets move fast. We move first.

Orange Juice Newsletter brings you expert driven insights - not headlines. Every day on your inbox.

By subscribing you agree to our Terms and conditions.

Editor's Picks

EUR/USD eyes 1.1800 barrier near two-month highs

EUR/USD extends its gains for the second consecutive day on Tuesday and approaches 1.1800. On the daily chart, technical analysis indicates a persistent bullish bias, as the pair moves upward within the ascending channel pattern. Additionally, the 14-day Relative Strength Index at 68.89 reaffirms the bullish bias.

GBP/USD climbs to 1.3500 area, renews ten-week high

GBP/USD extends its weekly rally and trades at its highest level since early October near 1.3500. The US Dollar remains under persistent bearish pressure heading into the holidays, while Pound traders largely brush off the latest interest rate cut from the Bank of England.

Gold approaches $4,500 as record-setting rally continues

Gold builds on Monday's impressive gains and advances toward $4,500, setting fresh record-highs along the way. Heightened geopolitical tensions, combined with the broad-based US Dollar (USD) weakness ahead of the Q3 GDP data, help XAU/USD preserve its bullish momentum.

US GDP expected to highlight steady growth in Q3

The United States Bureau of Economic Analysis (BEA) will publish the first preliminary estimate of the third-quarter Gross Domestic Product on Tuesday, at 13:30 GMT. Analysts expect the data to show annualized growth of 3.2%, following the 3.8% expansion in the previous quarter.

Ten questions that matter going into 2026

2026 may be less about a neat “base case” and more about a regime shift—the market can reprice what matters most (growth, inflation, fiscal, geopolitics, concentration). The biggest trap is false comfort: the same trades can look defensive… right up until they become crowded.

XRP steadies above $1.90 support as fund inflows and retail demand rise

Ripple (XRP) is stable above support at $1.90 at the time of writing on Monday, after several attempts to break above the $2.00 hurdle failed to materialize last week. Meanwhile, institutional interest in the cross-border remittance token has remained steady.