|

NZD/USD Price Analysis: Pair trades steady near 0.5900 with bullish bias ahead of Asia

  • NZD/USD trades around the 0.5900 zone after a quiet Wednesday European session.
  • Mixed momentum signals but moving averages reinforce the bullish tone.
  • Support seen at 0.5930 and 0.5908; resistance stands at 0.5969.

The NZDUSD pair held steady near the 0.5900 mark on Wednesday, posting a marginal daily gain as traders positioned ahead of the Asian session. The pair continues to consolidate in a tight range after recent upward momentum, suggesting a pause rather than a reversal.

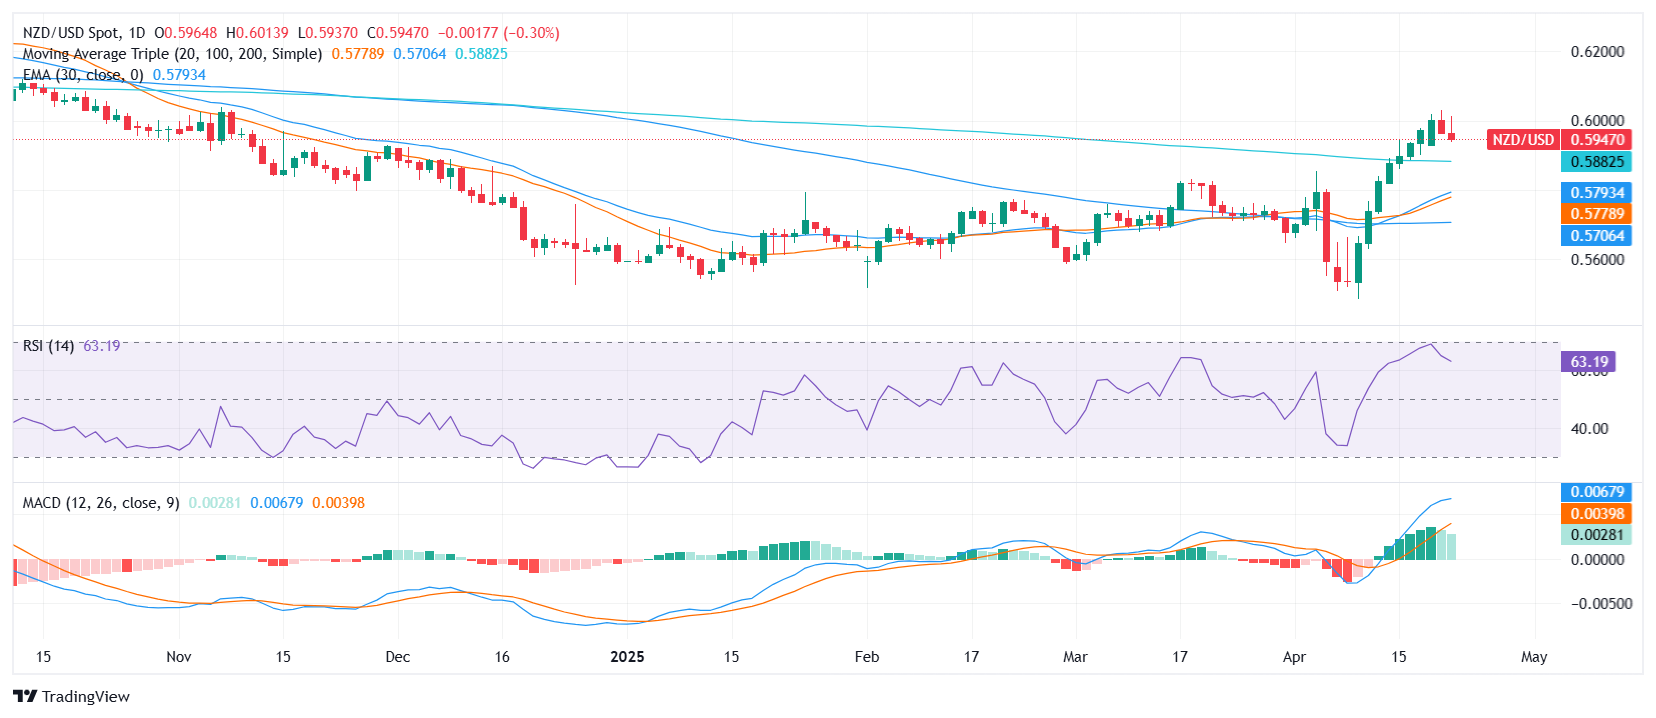
From a technical standpoint, the outlook remains broadly constructive. The Moving Average Convergence Divergence (MACD) indicates a buy signal, while the Relative Strength Index hovers around 62, signaling neutral momentum. Meanwhile, the Average Directional Index near 26 highlights a modest trend strength without strong conviction. On the downside, the Stochastic RSI Fast suggests overbought conditions and flashes a mild sell signal.

Despite the mixed short-term oscillators, the moving average setup is clearly bullish. The 20-day simple moving average at 0.5800, alongside the 100-day and 200-day SMAs at 0.5713 and 0.5886 respectively, all point upward. Additional short-term support is backed by the 10-day EMA at 0.5908 and the 10-day SMA at 0.5930.

Key support levels are aligned at 0.5930, 0.5908, and 0.5886. Resistance, meanwhile, is seen at 0.5969, which could cap further upside in the near term unless momentum builds decisively. For now, the pair trades within a tight band, retaining a bullish tilt as long as it holds above the 0.5880 area.

Daily chart

Author

Patricio Martín

Patricio is an economist from Argentina passionate about global finance and understanding the daily movements of the markets.

More from Patricio Martín
Share:

Editor's Picks

EUR/USD deflates to fresh lows, targets 1.1600

The selling pressure on EUR/USD now gathers extra pace, prompting the pair to hit fresh multi-week lows in the 1.1625-1.1620 band on Friday. The continuation of the downward bias comes in response to further gains in the US Dollar as market participants continue to assess the mixed release of US Nonfarm Payrolls in December.

GBP/USD breaks below 1.3400, challenges the 200-day SMA

GBP/USD remains under heavy fire and retreats for the fourth consecutive day on Friday. Indeed, Cable suffers the strong performance of the Greenback, intensified post-mixed NFP, and trades at shouting distance from its critical 200-day SMA near 1.3380.

Gold flirts with yearly tops around $4,500

Gold keeps its positive bias on Friday, adding to Thursday’s advance and challenging yearly highs in the $4,500 region per troy ounce. The risk-off sentiment favours the yellow metal despite the firmer tone in the Greenback and rising US Treasury yields.

Crypto Today: Bitcoin, Ethereum, XRP risk further decline as market fear persists amid slowing demand

Bitcoin holds $90,000 but stays below the 50-day EMA as institutional demand wanes. Ethereum steadies above $3,000 but remains structurally weak due to ETF outflows. XRP ETFs resume inflows, but the price struggles to gain ground above key support.

Week ahead – US CPI might challenge the geopolitics-boosted Dollar

Geopolitics may try to steal the limelight from US data. A possible US Supreme Court ruling on tariffs could dictate market movements. A crammed data calendar next week, US CPI comes on Tuesday; Fedspeak to intensify.

XRP trades under pressure amid weak retail demand

XRP presses down on the 50-day EMA support as risk-averse sentiment spreads despite a positive start to 2026. XRP faces declining retail demand, as reflected in futures Open Interest, which has fallen to $4.15 billion.